Intro :: tidy
http://r4ds.had.co.nz/introduction.html
https://blog.rstudio.org/
2 Introduction
일반적인 Data science 프로젝트 단계
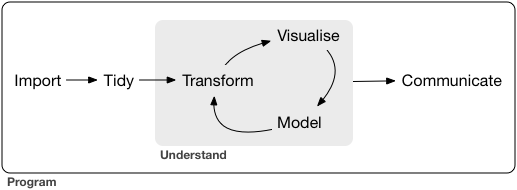
import
take data stored in a file, database, or web API, and load it into a data frame in R
Wrangling
tidying and transforming are called wrangling,
because getting your data in a form that’s natural to work with often feels like a fight
tidy (정돈)
Tidying your data : 각 column 은 a variable, 각 row는 observation 으로 정돈한다.
Transform (변형)
Observation을 관심있는 범위로 좁히는 거 (ex. 한 도시의 모든 사람들, 작년의 모든 데이터….)
가지고 있는 variable로 새로운 variable을 만드는 function ( 거리와 시간으로 속도를 만든다…)
통계량을 요약하여 계산하는 거 ( 평균,갯수…)
Knowledge를 만드는 2가지 main engines
Visualization
raise new questions about the data
Models
Once you have made your questions sufficiently precise, you can use a model to answer them
communication
you can also communicate your results to others
bigdata
If you’re routinely working with larger data (10-100 Gb, say), you should learn more about data.table.
big data problem might actually be a small data problem in disguise
your big data problem is actually a large number of small data problems
1.3.2 Python, Julia, and friends
You will get better faster if you dive deep, rather than spreading yourself thinly over many topics
R is not just a programming language, but it is also an interactive environment for doing data science.
1.3.4 Hypothesis confirmation
data analysis into two camps:
- hypothesis generation ( data exploration)
- hypothesis confirmation ( confirmatory analysis).
etc
install.packages("tidyverse")
install.packages(c("nycflights13", "gapminder", "Lahman"))
데이터 재현
- Run dput(mtcars) in R
- Copy the output
- In my reproducible script, type mtcars <- then paste.
