r2d3
https://cran.r-project.org/web/packages/r2d3/
https://cran.r-project.org/web/packages/r2d3/r2d3.pdf
https://blog.rstudio.com/2018/10/05/r2d3-r-interface-to-d3-visualizations/
r2d3: R Interface to D3 Visualizations
> install.packages("r2d3")

> library("devtools")
> devtools::install_github("rstudio/r2d3")
r2d3(data  = c(0.3, 0.6, 0.8, 0.95, 0.40, 0.20),
     script= system.file("examples/barchart.js", package="r2d3"))
D3 visualizations
https://github.com/d3/d3/wiki/Gallery
https://bl.ocks.org/
https://vida.io/explore:
D3 Scripts
File > New File >D3 Script (A simple template for a D3 script)
setwd("C:/Users/Administrator/Documents/RSource/d2visual")
library("r2d3")

r2d3(data  = c(0.3, 0.6, 0.8, 0.95, 0.40, 0.20),
     script= "simplebar.js")
Using r2d3 with Shiny
https://rstudio.github.io/r2d3/articles/shiny.html
library("shiny")
library("tidyverse")
library("r2d3")

ui <- fluidPage(
  inputPanel(
    sliderInput("bar_max", label="Max:",
                min=0.1, max=1.0, value=0.2, step=0.1)
  ),
  d3Output("d3"),
  verbatimTextOutput("selected")
)

server <- function(input, output) {
  output$d3 <- renderD3({
    r2d3(
      data=runif(5, 0, input$bar_max),
      options=list( color='orange'),
      script = "bar.js"
    )
  })
  output$selected <- renderText({
    bar_number <- req(input$bar_clicked)
    bar_number %>% as.numeric()
  })
}

shinyApp(ui, server)
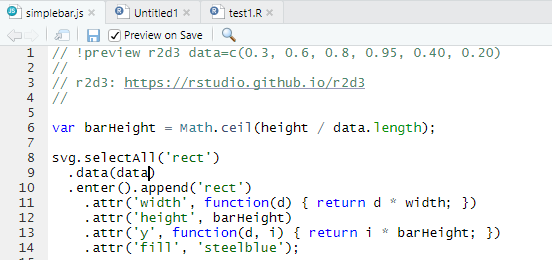
var barHeight = Math.ceil(height/data.length);
//console.log(barHeight);

var bars = r2d3.svg.selectAll('rect').data(r2d3.data);

bars
  .enter().append('rect')
  .attr('width',  function(d){ return d*width; })
  .attr('height', barHeight*0.9)
  .attr('y',      function(d, i){ return i*barHeight; })
  .attr('fill',   options.color);
bars
  .exit().remove();

bars
  .transition()
  .duration(66)
  .attr("width", function(d) { return d * width; });

bars
  .attr("d",   function(d) { return d; })
  .on("click", function(){ Shiny.setInputValue( "bar_clicked", value=d3.select(this).attr("d"), {priority: "event"} );});
dashboard
library("shiny")
library("shinydashboard")
library("shinydashboardPlus")
library("tidyverse")
library("r2d3")
library("webshot")  # for save_d3_png() function r
# webshot::install_phantomjs())


ui <- dashboardPagePlus(collapse_sidebar=T,
  header =  dashboardHeaderPlus(),
  sidebar = dashboardSidebar(),
  rightsidebar =  rightSidebar(),
  body =  dashboardBody(
    fluidRow(
      column(6,
        sliderInput("bar_max", label="Max:",min=0.1, max=1.0, value=0.2, step=0.1)
      ),
      column(6,
        verbatimTextOutput("D3_friendly_data"),
        verbatimTextOutput("selected")
      )
    ),
    fluidRow(
    d3Output("d3", width = "100%", height = "400px")
    )
  ),
  footer =  dashboardFooter()
)

server <- function(input, output) {
  observeEvent(input$bar_max, {
    dd <- runif(5, 0, input$bar_max)
    output$D3_friendly_data <- renderText({
      as_d3_data(dd)
    })
    viz <- r2d3(data=dd, script = "bar.js",
                css = "auto",
                dependencies = "d3-jetpack",
                options=list( color='orange'),
                d3_version = c("5", "4", "3"),
                container = "svg",
                viewer = c("internal", "external", "browser")
    )
    #save_d3_html(viz, file = tempfile(fileext = ".html"),  selfcontained = FALSE)
    #save_d3_png(viz, file, background = "white", width = 992, height = 744,  delay = 0.2, zoom = 1)
    output$d3 <- renderD3({
      viz
    })
  })
  output$selected <- renderText({
    bar_number <- req(input$bar_clicked)
    bar_number %>% as.numeric()
  })
}

shinyApp(ui, server) 