변곡점 (inflection points) 찾기
https://stats.stackexchange.com/questions/76959/finding-inflection-points-in-r-from-smoothed-data
diff
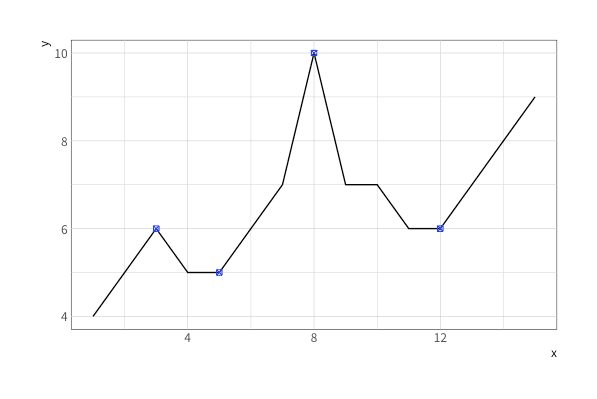
### sample Data ----------------------------------------------------------------
x = seq(1,15)
y = c(4,5,6,5,5,6,7,10,7,7,6,6,7,8,9)
data <- data.table(x,y)

data %>% ggplot(aes(x,y)) + geom_path()

### Inflection point
### concave upwards to downward  / concave downward to upwards
### increseing to decreaseing  / decreaseing to increasing
diff(y)>0          # 증가 T, 감소/변화없음 F
### positive to negative / negative to postive
diff( diff(y)>0 )  # -1 c(T,F) 증가하다감소, 0 c(T,T) c(F,F) 유지 , 1 c(F,T) 감소하다 증가
infl = c(FALSE,  diff(diff(y)>0)!=0, FALSE)

data <- data.table(x,y,infl)
sdata <- data[infl==T,]

data %>% ggplot(aes(x,y)) + geom_path() +
  geom_point(data=data[infl==T,], color="blue", shape=7, size=1.6)
## Smoothing -------------------------------------------------------------------
smoothing <- loess(y~x)
xl  <- seq(min(x),max(x), (max(x)-min(x))/10000)
out <- predict(smoothing, xl)
infl<- c(diff(diff(out)>0)!=0,F,F)

### Ploting =-------------------------------------------------------------------
data %>% ggplot(aes(x,y)) + geom_path() + geom_smooth()

### type1 ----
plot(x, y, type="l")
lines(xl, out, col='red', lwd=2)
points(xl[infl ], out[infl ], col="blue")

### type2 ----
sdata <- data.table(xl,out, infl)
data %>% ggplot(aes(x,y)) + geom_path() +
  geom_point(data=sdata, aes(xl, out), size=.1, color="red") +
  geom_point(data=sdata[infl], aes(xl, out), size=1.6, color="blue", shape=1)
derivatives (Savitzky-Golay-filters)
fda: Functional Data Analysis
https://cran.r-project.org/web/packages/fda/fda.pdf
ChangePoint Analysis
https://onesixx.com/changepoint-analysis/
### Quandl.com for Time Series Datasets
library(Quandl)                        # install.packages("Quandl")
Quandl.api_key("6T4f9gpDJDhu2-L58Mfw") # https://docs.quandl.com/docs/r
# Quandl.search("Housing Units Completed", source="FRED")

data <- Quandl("FRED/COMPUTSA") %>% data.table()       # download the data
data <- data[order(Date)]
#data <- data[Date>="2000-01-01" & Date<="2006-12-01", ]  # create subset
value.ts <- ts(data$Value, frequency=12, start=c(2000,1), end=c(2006,12))
plot(value.ts)

library(changepoint) # install.packages("changepoint")
# mean changepoints using PELT(Pruned Exact Linear Time) & Binary Segmentation
# Choice of "AMOC", "PELT", "SegNeigh" or "BinSeg".
ans = cpt.mean(value.ts, method="PELT")
cpts(ans)

ans = cpt.mean(value.ts, method="BinSeg")
cpts(ans)
plot(ans, cpt.width=6)


vvalue = cpt.var(diff(value.ts), method="BinSeg")
vvalue = cpt.meanvar(diff(value.ts), test.stat = "Poisson", method = "BinSeg")
cpts(vvalue)
plot(vvalue)

par(mfrow=c(2,1))
plot(value.ts)
plot(vvalue)

vnvalue = cpt.var(diff(value.ts), method="PELT")
cpts(vnvalue) 