ggplot Facet
그룹화 방법
- 시각적요소를 활용 : color, shape, size
- 상대적 위치기반으로 나누어 plotting: facet
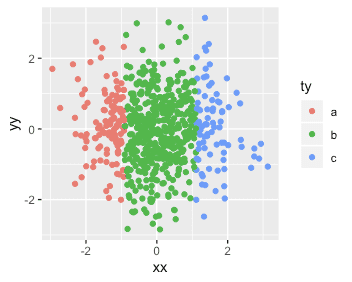
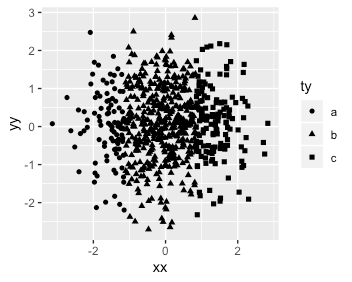
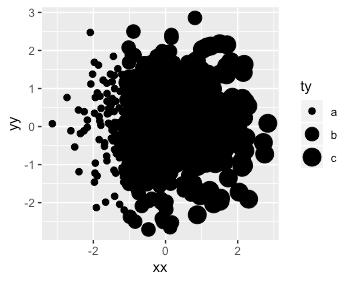
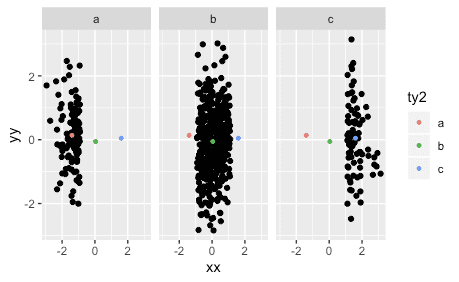
set.seed(666)
dd <- data.table( xx=rnorm(666), yy=rnorm(666))
dd[ , ty:=cut(xx, 3, labels=letters[1:3])]

dd %>% ggplot(aes(xx,yy)) + geom_point(aes(color=ty))
dd %>% ggplot(aes(xx,yy)) + geom_point(aes(shape=ty))
dd %>% ggplot(aes(xx,yy)) + geom_point(aes(size=ty))

dd %>% ggplot(aes(xx,yy)) + geom_point() + facet_wrap(~ty)
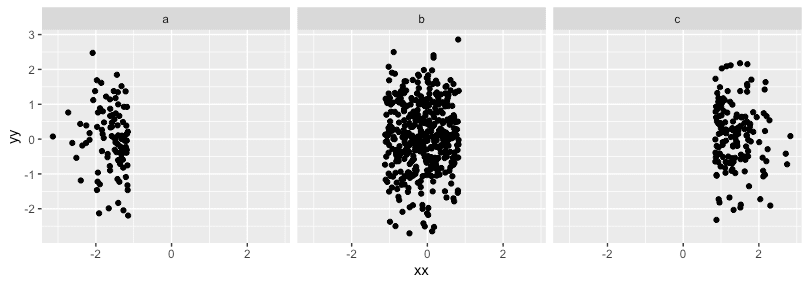
(시각적요소와는 달리) facet에서는 중복없이 plot을 나누므로, 그룹간의 비교를 좀 더 명확하게 볼수 있다.
추가적으로, 각 평균을 같이 배치하거나, 나머지 그룹값을 아래에 추가하는 방법을 활용할수 있다.
dd_each_mean <- dd %>% group_by(ty) %>% summarise(xx=mean(xx), yy=mean(yy)) %>% rename(ty2 =ty)
dd %>% ggplot(aes(xx,yy)) + geom_point() +
geom_point(data=dd_each_mean, aes(color=ty2), size=1) +
facet_wrap(~ty)
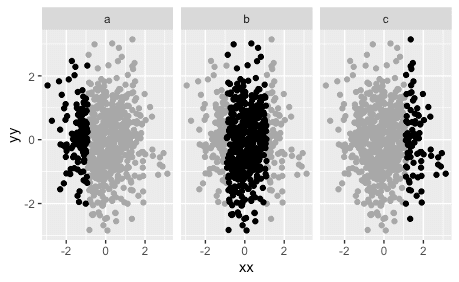
dd_bg <- dd[,c("xx","yy")]
dd %>% ggplot(aes(xx,yy)) + geom_point(data=dd_bg, color="grey66") +
geom_point() + facet_wrap(~ty)
Continuous Variable 를 discrete Variable로 변환하여 Faceting
| cut_interval(x, n) | 같은 길이로 나누기 |
| cut_width(x, width) | 폭너비인 bin으로 나누기 |
| cut_number(x, n) | 같은 갯수로 나누기 |
Facetting
| facet_null() | facet_wrap() | facet_grid() |
|---|---|---|
| 단일 plot 원상복귀시 주로 사용한다. | 변수의 조합하여 1차원 패널의 집합
fomula의 형태와 사실 상관없이 가능한 조합으로 생성된 plot을 Page에 구분하여 그린다. | 2차원 grid fomula의 행/열에 변수지정에 따라 일단 grid를 만들고, 데이터의 유/무와 상관없이 모든 조합을 2차원형태로 plotting한다. |
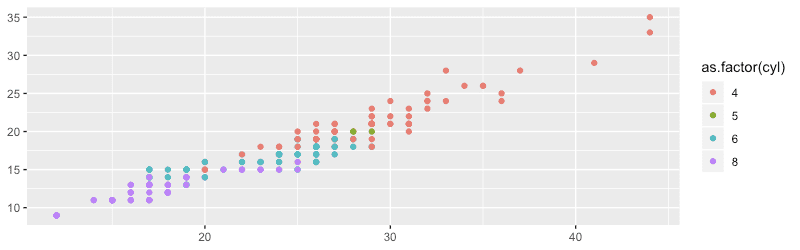
dd <- data.table(mpg)[, c("hwy","cty","drv","cyl","year")]
p <- dd %>% ggplot(aes(hwy, cty, color=as.factor(cyl))) + geom_point() +
               labs(x=NULL, y=NULL) + theme(legend.position="none")
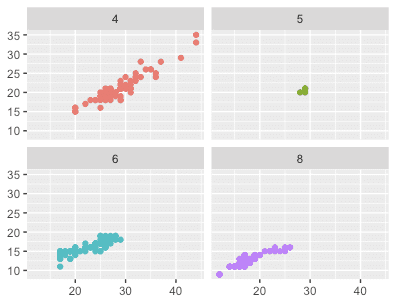
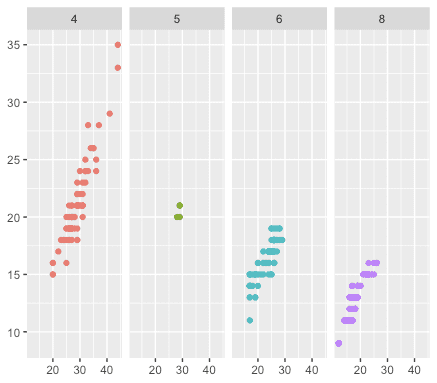
facet_wrap()
가장 일반적인 형태
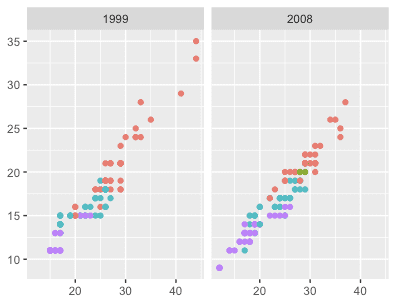
p + facet_wrap(~ cyl)
p + facet_wrap(~ year)
형태는 다르지만 (~A+B+C) , (A~B+C), (A+B ~C) 순서만 다를뿐 결과는 같다.
각 factor변수의 level은 drv(3개), year(2개), cyl(4개)로 전체 조합은 24개이지만,
(24개가 아닌) 가능한 조합인 16개 plot만 그려진다.
조합에 수에 따라 자동적으로 word-wrap과 같이 row를 만들어 낸다.
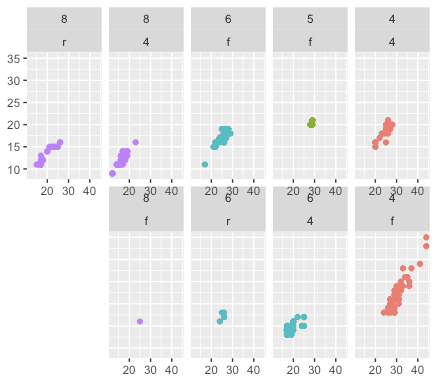
p + facet_wrap(drv ~ year+cyl)
p + facet_wrap(year ~ cyl+drv)
p + facet_wrap(cyl+drv ~ year)
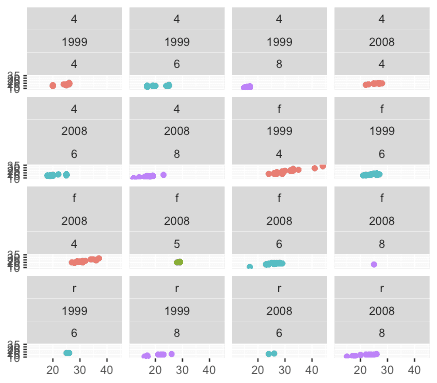
ncol/nrow 둘중에 하나만 정의하면, 나머지는 자동적으로 결정되어 하나만 설정하면된다. as.table은 Sorting의 기준을 설정하는 argument로 기본값이 True (위 왼쪽에서 아래오른쪽 순)이고, dir은 plot을 나열하는 순서의 기준을 설정하는 argument로 기본값이 horizontal (왼쪽에서 오른쪽 순)이다.
p + facet_wrap(cyl~drv)
p + facet_wrap(cyl~drv, nrow=1)
p + facet_wrap(cyl~drv, ncol=5, nrow=2, as.table=F, dir="v")
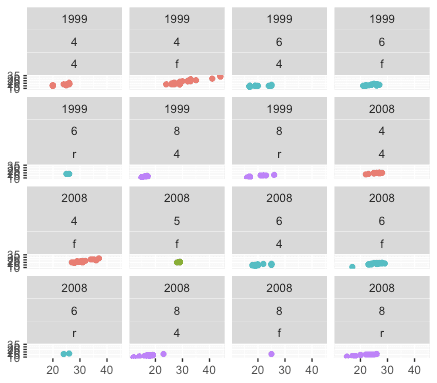
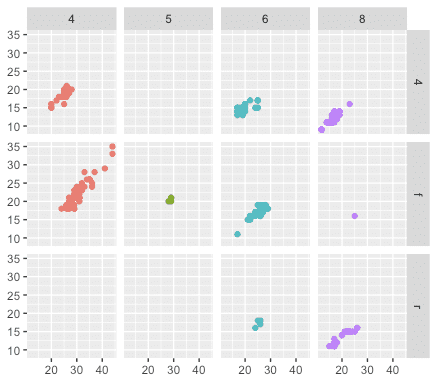
facet_grid()
각 변수의 level의 length를 기준으로 Grid를 만들고, 들어갈 수 있는 곳에 Plot을 생성한다.
각 factor변수의 level은 drv(3개), year(2개), cyl(4개)로 전체 조합은 24개이므로,
각 plot에 데이터가 없더라도 24개 plot이 모두 그려진다.
horizontally/ vertically 로 자를경우에는 . 을 표기하여 가독성을 높인다.space라는 argument는 scale과 값은 같다.
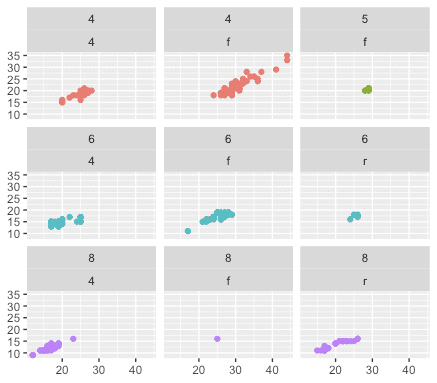
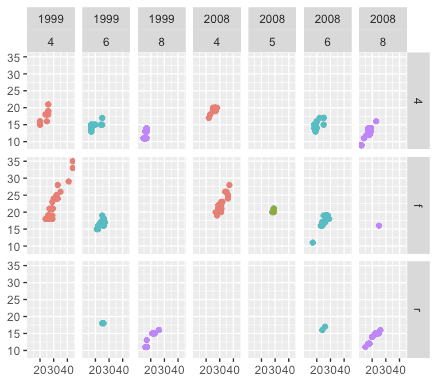
p + facet_grid(.~cyl)
p + facet_grid(drv~cyl)
p + facet_grid(drv~year+cyl)
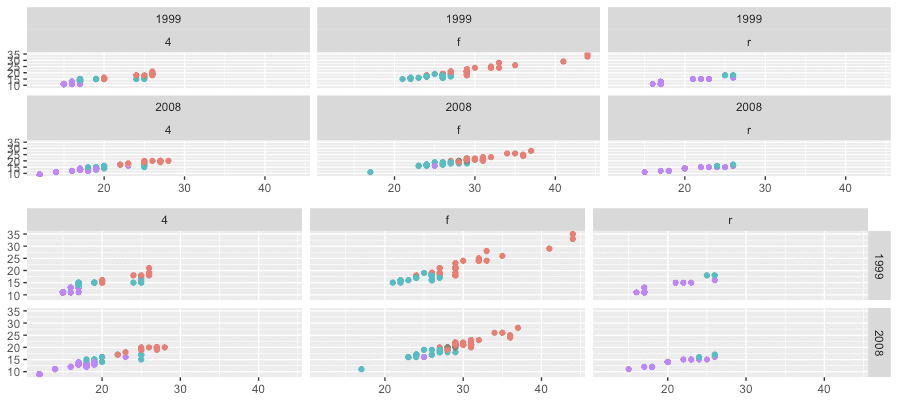
facet_wrap vs. facet_grid 비교
gridExtra::grid.arrange(
  p + facet_wrap(year~drv),
  p + facet_grid(year~drv)
)
using string variable
p + facet_grid(drv~year+cyl)
#same
fv <- 'drv~year+cyl'
p + facet_grid(as.formula(glue({fv})))
위치를 제어하는 요소
Layer 안에 겹치는 Object들 위치 조정
Data의 subset들을 한 페이지에 분리하여 여러 Plot으로 배치
Data가 위치를 매핑하는 방법
facet_wrap()과 facet_grid()의 argument로 사용할 때,
scales=
space =
| "fixed" | x, y scale 고정 |
| "free" | panel에 따라 x, y 의 scale이 다르다. | |
| "free_x" | x scale는 데이터에 따라, y scale는 고정 | |
| "free_y" | y scale는 데이터에 따라, x scale는 고정 |
dd <- subset(mpg, cyl!=5 & drv%in%c("4","f") & class!="2seater")
dd$model        <- reorder(dd$model,         dd$cty)
dd$manufacturer <- reorder(dd$manufacturer, -dd$cty)

dd %>% ggplot(aes(cty, model)) + geom_point()

dd %>% ggplot(aes(cty, model)) + geom_point() +
       facet_grid(manufacturer~.)

dd %>% ggplot(aes(cty, model)) + geom_point() +
  facet_grid(manufacturer~., scales="free_y")

dd %>% ggplot(aes(cty, model)) + geom_point() +
  facet_grid(manufacturer~., scales="free_y", space="free_y") +
  theme(strip.text.y=element_text(angle=0))
Scailng 조합을 통해 2차원 좌표계 만들기
panel로 분리된 sub-plot
| lable | _both | facet의 label에 값/변수명 둘다 출력 |
| _bquote | facet의 label에 값에 따라 변형 | |
| _parsed | facet의 label에 plotmath형식의 수식출력 | |
| _value | facet의 label에 값 출력 |
-----------------------------------
position_dodge Dodge overlapping objects side-to-side
position_fill Stack overlapping objects on top of each another
position_identity Don't adjust position
position_jitter Jitter points to avoid overplotting
position_jitterdodge Simultaneously dodge and jitter
position_nudge Nudge points a fixed distance
position_stack Stack overlapping objects on top of each another
facet_grid Lay out panels in a grid
facet_wrap Wrap a 1d ribbon of panels into 2d
