ggpmics
http://www.ggplot2-exts.org/gallery/
http://www.ggplot2-exts.org/ggpmisc.html
https://bitbucket.org/aphalo/ggpmisc
http://docs.r4photobiology.info/ggpmisc/index.html
https://cran.r-project.org/web/packages/ggpmisc/index.html
R package ‘ggpmisc’
The package manual describes in more detail the items listed above, and
the vignette gives several examples of plots produced with the package.
Please, see the web site r4photobiology for details and update notices.
Other packages, aimed at easing photobiology-related calculations including the quantification of biologically effective radiation in meteorology are available as part of a suite described at the same website.
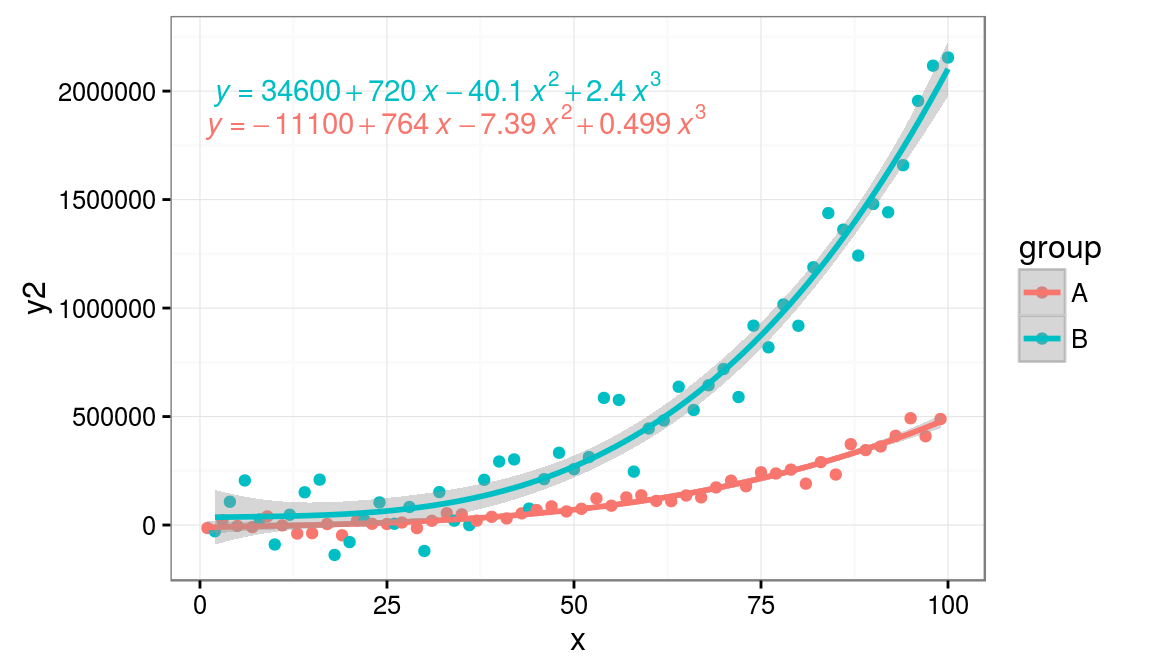
stat_poly_eq Add a label for a fitted linear model to a plot.
http://mqasim.me/?p=122763 Add P-values and Significance Levels to ggplots
https://cran.r-project.org/web/packages/ggpmisc/index.html
: Miscellaneous Extensions to ‘ggplot2’
User Guide: 1 Plotting
User Guide: 2 Density-based filtering
User Guide: 3 Debugging ggplots
User Guide: 4 Manipulation of plot layers
