ggplot text Published by onesixx 20-07-30 20-07-30
Title & A xis name
labs
Tooth <- ToothGrowth %>% setDT()
Tooth[ , `:=`(dose=as.factor(dose))]
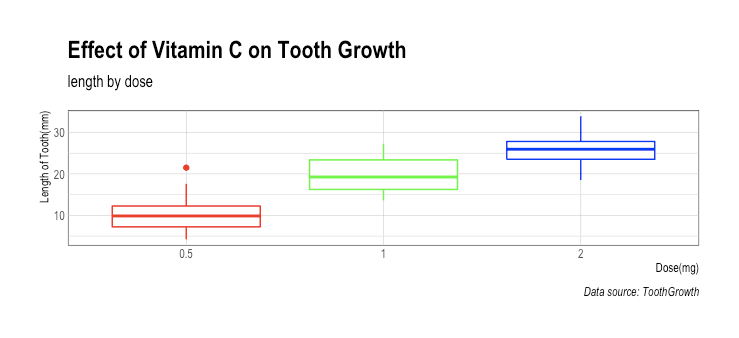
boxP <- Tooth %>% ggplot(aes(x=dose, y=len)) + geom_boxplot(aes(color=dose)) +
scale_color_manual(values=c("red", "green", "blue")) boxP + labs(
\tx="Dose(mg)", y="Length of Tooth(mm)",
\ttitle="Effect of Vitamin C on Tooth Growth",
\tsubtitle="length by dose",
\tcaption= "Data source: ToothGrowth")
PlantGrowth %>% ggplot(aes(x=group, y=weight))+
\tgeom_boxplot(fill="lightgray", notch=T, notchwidth=.5) +
\tlabs(x="Dried weight of plants")
Axis Labels & breaks
scale_x_, theme
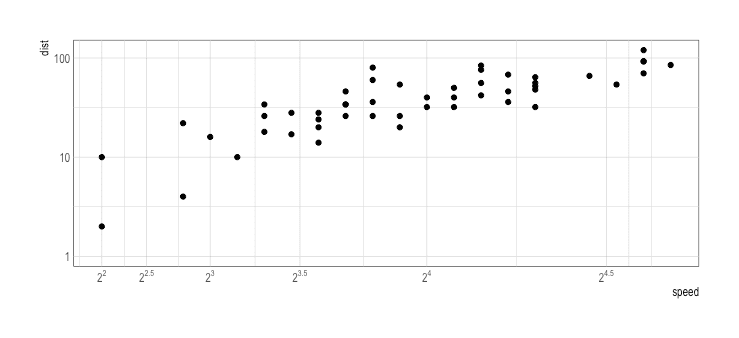
scatterP <- cars %>% ggplot(aes(speed, dist)) + geom_point() scatterP +
scale_x_continuous(breaks = trans_breaks("log2", function(x) 2^x),
\t\t\t\t\t labels = trans_format("log2", math_format(2^.x))) +
scale_y_continuous(limits=c(1,120), trans="log10" )
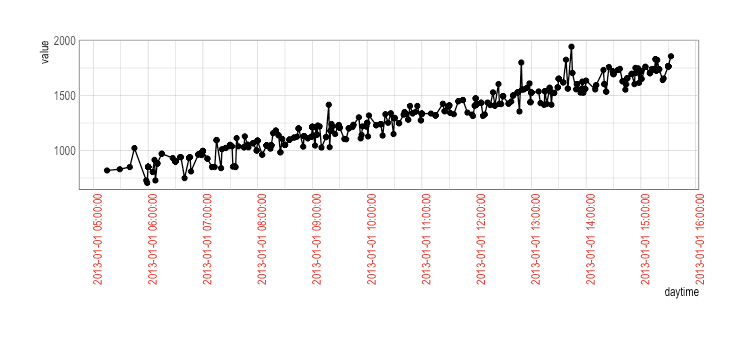
fl <- nycflights13::flights
dd <- with(fl, data.table(daytime=make_datetime(year, month, day, hour, minute, 0),
					                value= sched_arr_time))
dd <- dd[order(daytime), ][,value:=mean(value), by=daytime]
delayP <- dd[1:500,] %>% ggplot(aes(daytime, value)) + geom_path() + geom_point()
delayP +
\tscale_x_datetime(labels=date_format("%Y-%m-%d %H:%M:%S"),
\t\t\t\t\t\t\t\t\t breaks=date_breaks("1 hour"))+
\ttheme(axis.text.x=element_text(angle=90, color="red"))
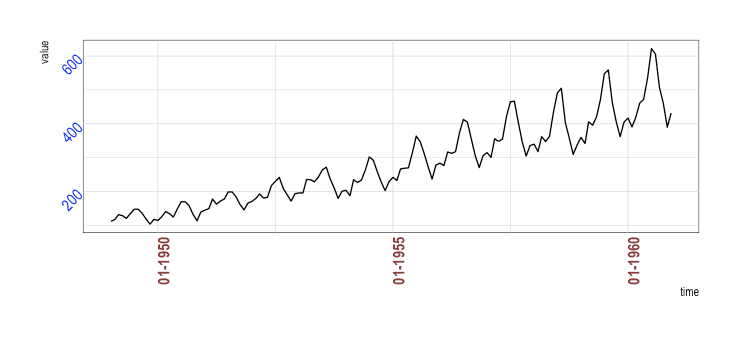
passenger <- tsbox::ts_dt(AirPassengers)
timeP <- passenger %>% ggplot(aes(time, value)) + geom_path()
timeP +
\tscale_x_date(labels=date_format("%m-%Y")) +
\ttheme(axis.text.x=element_text(size=12, angle=90, face="bold", color="#993333"),
\taxis.text.y=element_text(size=12, angle=45, color= "blue"))
text annotation(주석)
geom_text (), geom_label ()annotate ()crimes <- USArrests %>% setDT(keep.rownames=T)
crimesP <- crimes %>% ggplot(aes(x=UrbanPop, y=Murder)) + geom_point() crimesP +
geom_text(aes(label=rn), vjust=-.6, size=3, color="red")
scatterP <- cars %>% ggplot(aes(speed, dist)) + geom_point() scatterP + annotate("text", x=15, y=100,
label="Scatter plot", color="red")