ggplot line
http://www.sthda.com/english/wiki/ggplot2-add-straight-lines-to-a-plot-horizontal-vertical-and-regression-lines
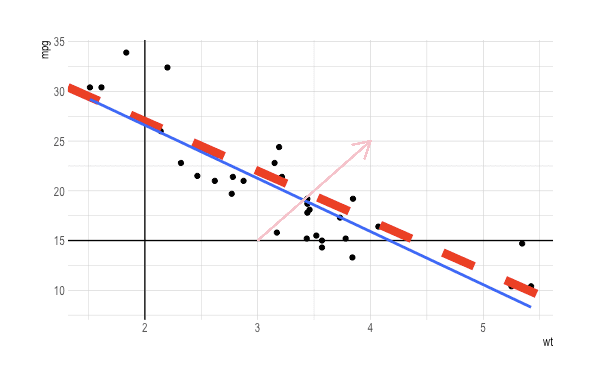
mtcars %>% ggplot(aes(x=wt, y=mpg)) + geom_point() +
  geom_hline(yintercept=15) +
  geom_vline(xintercept=2)  +
  geom_abline(intercept=37, slope=-5, linetype="dashed", color="red", size=3)+
  stat_smooth(method="lm", se=F) +
  geom_segment(aes(x=3, y=15, xend=4, yend=25), arrow=arrow(length=unit(5,"mm")), color="pink")
mtcars %>% ggplot(aes(x=wt, y=mpg)) + geom_point() +
 \tgeom_hline(data=mtcars, aes(yintercept=cyl))
