ggplot Grid arrange
ggarrange(p1, p2, p3, nrow=2)
https://cran.r-project.org/web/packages/egg/vignettes/Ecosystem.html
http://www.sthda.com/english/articles/24-ggpubr-publication-ready-plots/81-ggplot2-easy-way-to-mix-multiple-graphs-on-the-same-page/
https://cran.r-project.org/web/packages/ggplotify/vignettes/ggplotify.html
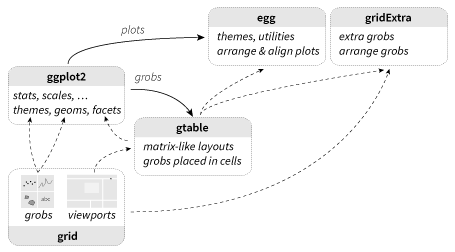
하나의 ggplot은 축/패널/제목/범례 등의 여러 object들로 구성된다.
ggplot의 layout은 기저의 grid패키지를 기반한 gtable패키지를 통해 정의된다.
egg나 grideExtra패키지를 활용해서 한 페이지에 여러개 Plot들을 담을 수 있다.
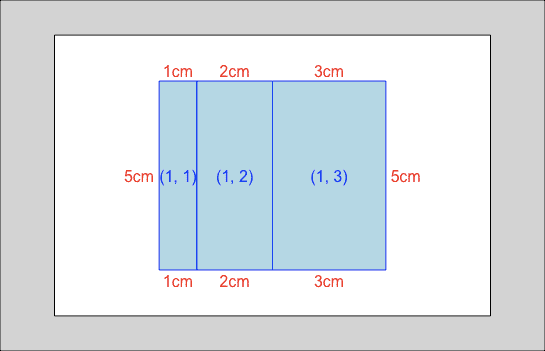
library('gtable')    # Create a new grob table

tmp <- gtable( widths =unit(1:3, c("cm") ),
               heights=unit(  5,   "cm"  ) )
#TableGrob (1 x 3) "layout": 0 grobs
#여기서, grob는 Grid Graphical Objects
tmp %>% gtable_show_layout()
library(ggplot2)
data('mtcars')
dd <- mtcars %>% as.data.table(keep.rownames=T)

p1 <- dd %>% ggplot(aes(x=mpg, y=wt, color=cyl)) + geom_point()
p2 <- dd %>% ggplot(aes(x=mpg)) + geom_histogram() + ggtitle("Plot2")
p3 <- dd %>% ggplot(aes(x=mpg)) + geom_dotplot() + ggtitle("Plot3")
p4 <- p1 + facet_wrap( ~ carb, nrow=1) +
        theme(legend.position = "none") + labs(title="facetted plot4")
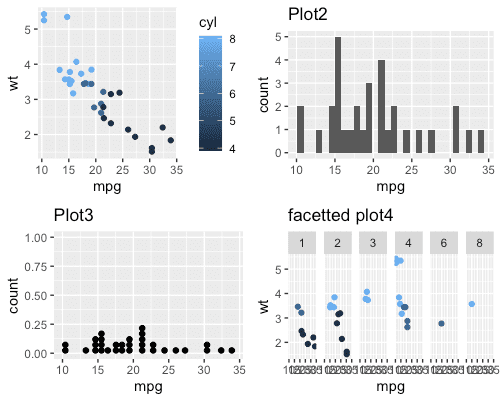
grid형태로 plot 나열하기
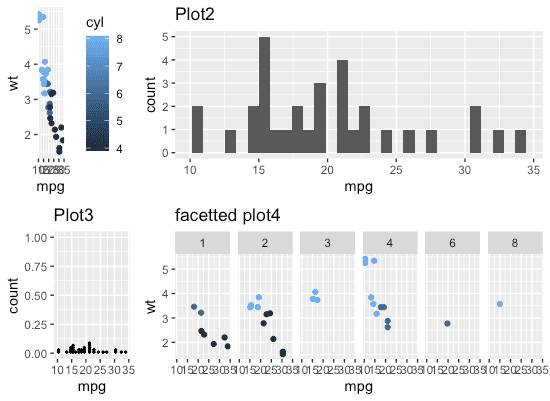
gridExtra::grid.arrange()
가장 쉬운 방법으로 par(mfrow=c(r,c))와 비슷
library('gridExtra') # Helper Functions for "Grid" Graphics
# par(mfrow=c(r,c))
grid.arrange(grobs=list(p1,p2,p3,p4), nrow=2, ncol=2)
layout_matrix=rbind(c(1,NA, 2),
c(3, 4, 4)) )
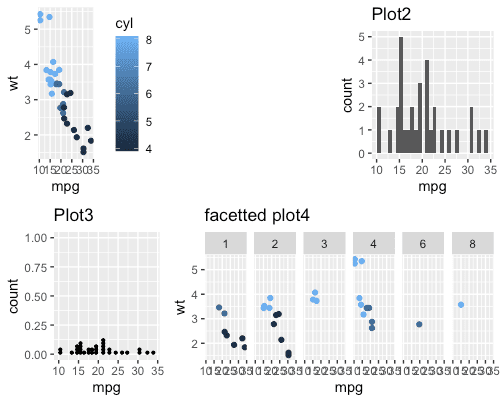
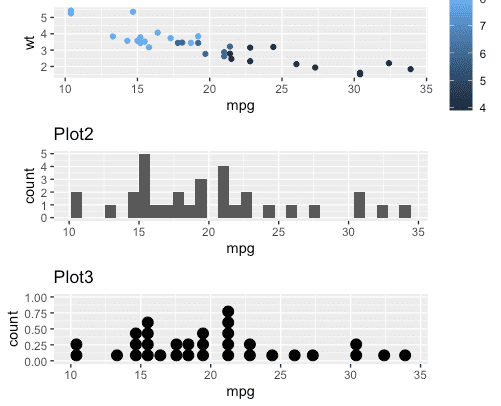
egg::ggarrange()
library(egg) # Helper Functions for Expose/Arrage ggplot2 layouts
ggarrange(p1, p2, p3)
ggarrange(p1, p2, p3, ncol=2)
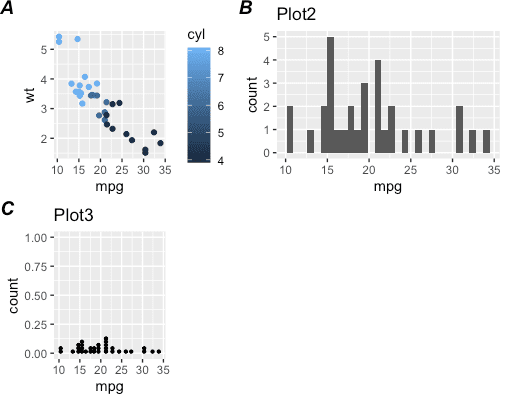
ggarrange(p1, p2, p3, ncol=2, labels=c("A","B","C"))
ggarrange(p1, p2, p3, widths = c(1,2), labels=c("A","B","C")) #, ncol=2, nrow=2)
plot에 plot넣기
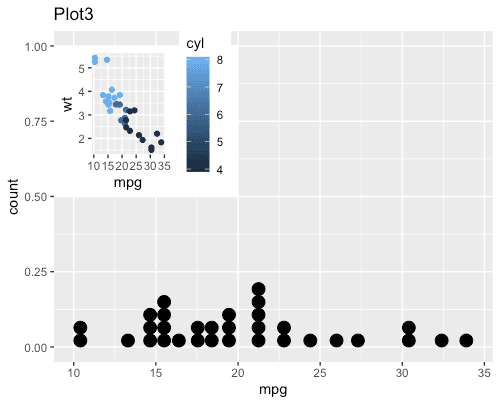
annotation_custom()
p3 + annotation_custom(grob=ggplotGrob(p1), xmin=-Inf, xmax=20, ymin=.5, ymax=1)