dual y-axes(secondary axis) in ggplot
https://rpubs.com/MarkusLoew/226759 Markus Loew, 14 November 2016
http://stackoverflow.com/a/3101876
scale_x_continuous() 또는 scale_y_continuous()를 활용해서 주 axis의 1:1 변형에 의해, 보조 axis를 나타낼수 있다.
library(readxl)
library(fst)
DATA_PATH <- "~/DATA/battery/A123/"    #my room
####### Initial Fst -------------------------------------------------------------
URL <- "https://data.matr.io/1/api/v1/file/5c86c0bafa2ede00015ddf70/download"
# Download file 2017-05-12_6C-50per_3_6C_CH36.csv
read_csv(str_c(DATA_PATH,"2017-05-12_6C-50per_3_6C_CH36.csv")) %>%
  write_fst(str_c(DATA_PATH, "2017-05-12_6C-50per_3_6C_CH36.fst"))

# Load Data ---------------------------------------------------------------
dd0 <- read_fst(file.path(DATA_PATH, "2017-05-12_6C-50per_3_6C_CH36.fst")) %>% data.table()
dd1 <- dd0[Cycle_Index==16 ,.(Time=Test_Time,Current,Voltage)]
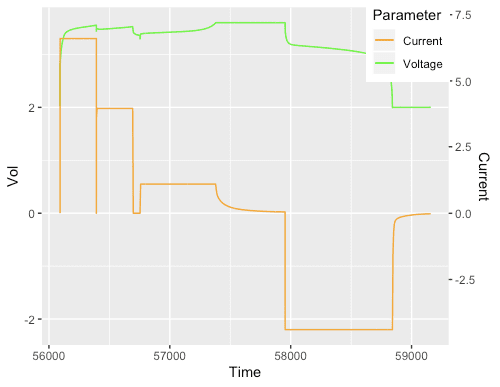
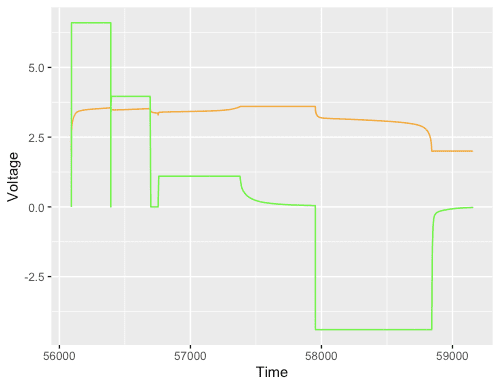
dd1 %>% ggplot(aes(x=Time)) +
  geom_line(aes(y=Voltage), color="orange") +
  geom_line(aes(y=Current), color="green")

dd1$Voltage %>% range() #  1.997232  3.600379
dd1$Current %>% range() # -4.400535  6.603252
dd1 %>% ggplot(aes(x=Time)) +
  geom_line(aes(y=Voltage,   color="Voltage")) +
  geom_line(aes(y=Current/2, color="Current")) +  #transformed to match roughly the range of the Vol
  scale_y_continuous(sec.axis=sec_axis(~.*2, name="Current")) +
  # color, legend, position
  scale_colour_manual(values=c("orange", "green")) +
  labs(x="Time", y="Vol", color="Parameter") +
  theme(legend.position = c(0.9, 0.9))