brushedPoints
https://github.com/rstudio/shiny-examples/blob/master/105-plot-interaction-zoom/app.R
library(ggplot2)
library(Cairo) # For nicer ggplot2 output when deployed on Linux
ui <- fluidPage(
fluidRow(
column(4, class="well",
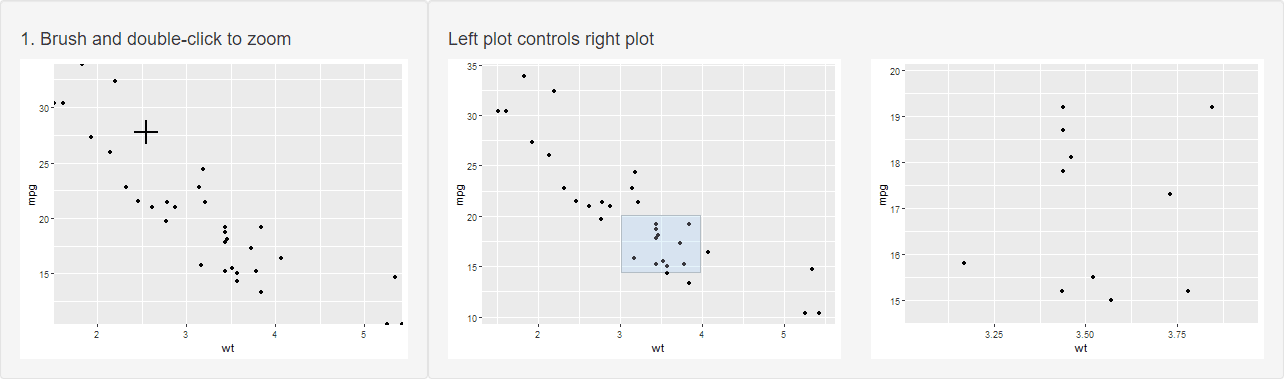
h4("1. Brush and double-click to zoom"),
plotOutput("plot1", height=300,
dblclick = "plot1_dblclick",
brush = brushOpts(id="plot1_brush", resetOnNew=TRUE)
)
),
column(8, class="well",
h4("Left plot controls right plot"),
fluidRow(
column(6,
plotOutput("plot2", height=300,
brush = brushOpts(id="plot2_brush", resetOnNew=TRUE)
)
),
column(6,
plotOutput("plot3", height = 300)
)
)
)
)
)
server <- function(input, output) {
# -------------------------------------------------------------------
# Single zoomable plot (on left)
ranges <- reactiveValues(x=NULL, y=NULL)
output$plot1 <- renderPlot({
mtcars %>% ggplot(aes(wt, mpg)) + geom_point() +
coord_cartesian(xlim=ranges$x,
ylim=ranges$y, expand=FALSE)
})
# When a double-click happens, check if there's a brush on the plot.
# If so, zoom to the brush bounds; if not, reset the zoom.
#OBSERVE EVENT ----
observeEvent(input$plot1_dblclick, {
brush <- input$plot1_brush
if (!is.null(brush)) {
ranges$x <- c(brush$xmin, brush$xmax)
ranges$y <- c(brush$ymin, brush$ymax)
} else {
ranges$x <- NULL
ranges$y <- NULL
}
})
# -------------------------------------------------------------------
# Linked plots (middle and right)
ranges2 <- reactiveValues(x=NULL, y=NULL)
output$plot2 <- renderPlot({
mtcars %>% ggplot(aes(wt, mpg)) + geom_point()
})
output$plot3 <- renderPlot({
mtcars %>% ggplot(aes(wt, mpg)) + geom_point() +
coord_cartesian(xlim=ranges2$x,
ylim=ranges2$y, expand=FALSE)
})
#OBSERVE ----
observe({
brush <- input$plot2_brush
if (!is.null(brush)) {
ranges2$x <- c(brush$xmin, brush$xmax)
ranges2$y <- c(brush$ymin, brush$ymax)
} else {
ranges2$x <- NULL
ranges2$y <- NULL
}
})
}
shinyApp(ui, server)
brushedPoints(mtcars, input$plot_brush, xvar="wt", yvar="mpg")
library(ggplot2)
ui <- basicPage(
  plotOutput("plot1", brush = brushOpts(id = "plot_brush", fill = "#ccc"),
             dblclick = dblclickOpts(id = "plot_dbclick"),
             hover = hoverOpts(id = "plot_hover", delay=500, nullOutside=TRUE), height=250),
   verbatimTextOutput("info1"),
   verbatimTextOutput("info2")

)

server <- function(input, output) {
  output$plot1 <- renderPlot({
    #mtcars %>% ggplot(aes(x=wt, y=mpg)) + geom_point() + facet_grid(. ~ cyl)
    p <-  ggplot(mtcars, aes(x=wt, y=mpg))
    p <-  p + geom_point()
    #p <-  p+  facet_wrap( ~ mtcars[["gear"]], scales = "free", ncol = 4)
    p <- p + facet_wrap(as.formula(paste("~", "gear")), scales = "free", ncol = 4)

    p
  })


  observeEvent(input$plot_dbclick, {
    output$info1 <- renderPrint({
      print(isolate(input$plot_brush))
    })
  })


  output$info2 <- renderPrint({
    sixx <- "gg"
    brushedPoints(mtcars, input$plot_brush, xvar="wt", yvar="mpg")
  })
}

shinyApp(ui, server)
