ShinyDashboard
https://rstudio.github.io/shinydashboard/
https://www.rdocumentation.org/packages/shinydashboard/versions/0.6.1
https://rdrr.io/cran/shinydashboard/api/
https://wikitech.wikimedia.org/wiki/Building_a_Shiny_Dashboard
flexDashboard가 rmarkdown기반이라면, ShinyDashboard는Shiny기반이다.
상용 dashboard도 있다. cf> tableau https://www.tableau.com
http://datadrivensecurity.info/blog/posts/2015/Jan/building-security-dashboards-with-r-and-shiny-shinydashboard/
library(shiny)
library(shinydashboard)
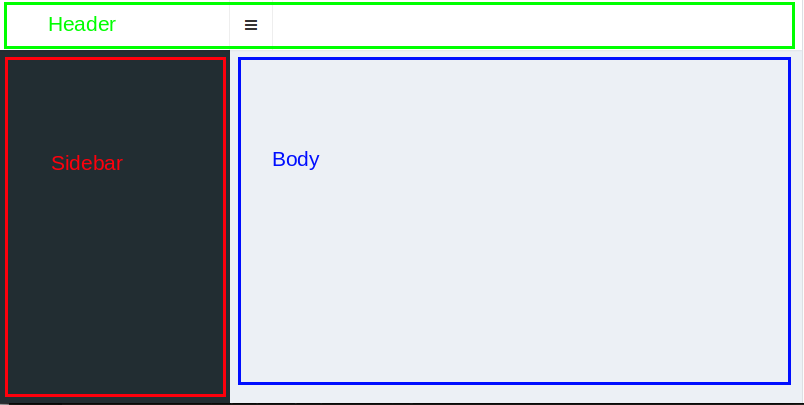
# Setup ShinyApp UI components -------------------------------------------
header <- dashboardHeader()
sidebar <- dashboardSidebar()
body <- dashboardBody()
ui <- dashboardPage( skin="black",
header,
sidebar,
body
)
# Setup ShinyApp Server(back-end) components ------------------------------
server <- function(input, output, session) {
}
# Render Shiny app --------------------------------------------------------
shinyApp(ui, server)
Header
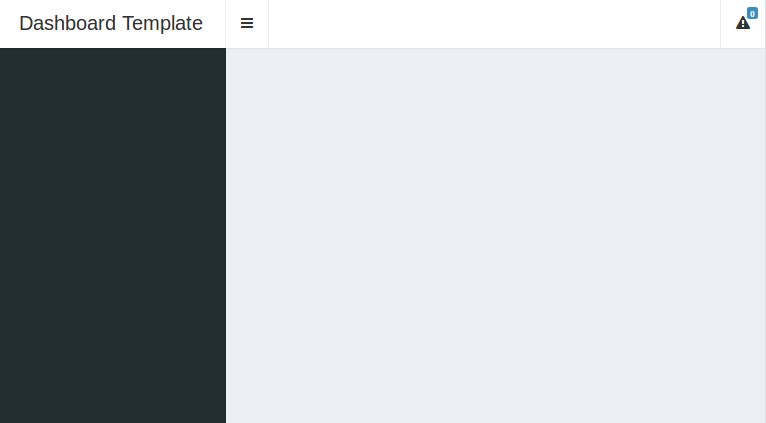
dash_header <- dashboardHeader(title="Dashboard Template", dropdownMenu(type="notifications"))
Sidebar
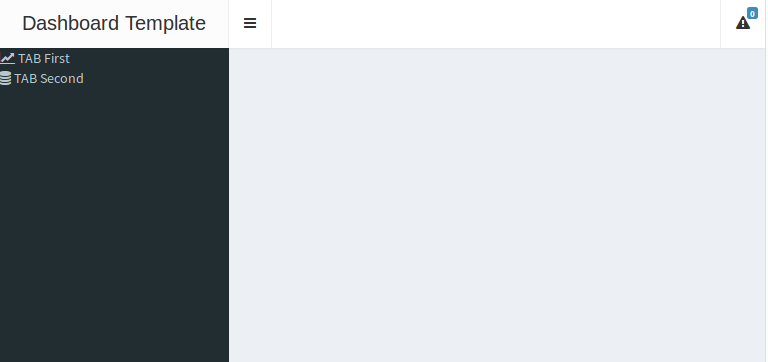
dash_sidebar <- dashboardSidebar(
                    menuItem("TAB First",   tabName ="tab01", icon=icon("line-chart")),
                    menuItem("TAB Second",  tabName ="tab02", icon=icon("database"))
                )
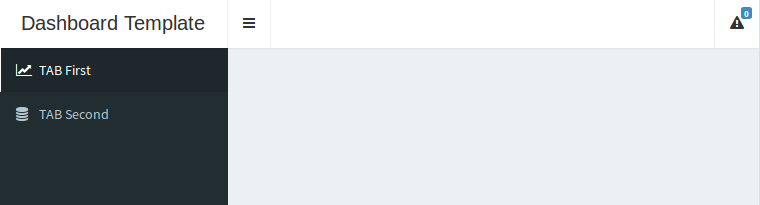
dash_sidebar <- dashboardSidebar(
                   sidebarMenu(id = "sidebarmenu",
                        menuItem("TAB First",   tabName ="tab01", icon=icon("line-chart")),
                        menuItem("TAB Second",  tabName ="tab02", icon=icon("database"))
                    )
                )
Body
dash_body    <- dashboardBody(
                    fluidRow(
                        box(title="Column", status="primary", width=NULL, collapsible=T,
                            selectInput("t1p1_dataset", label="Data Set:", choices="Not selected!"),
                            actionButton("Btn_load_t1p1_dataset", "Load")
                        )
                    )
                )
server <- function(input, output, session) {
            output$histogram <- renderPlot({
                                        hist(faithful$eruptions)
                                })
          }
Sidebar의 Tab과 연결
library(shiny)
library(shinydashboard)
# Setup ShinyApp UI components -------------------------------------------
dash_header <- dashboardHeader(title="Dashboard Template", dropdownMenu(type="notifications"))
dash_sidebar <- dashboardSidebar(
sidebarMenu(id = "sidebarmenu",
menuItem("TAB First", tabName ="tab01", icon=icon("line-chart")),
menuItem("TAB Second", tabName ="tab02", icon=icon("database"))
)
)
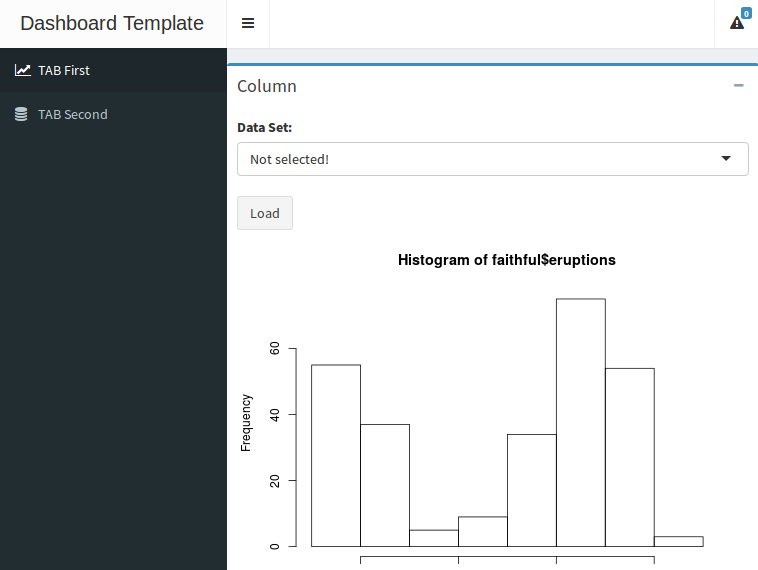
dash_body <- dashboardBody(
tabItems(
tabItem(tabName="tab01",
fluidRow(
box(title="Column", status="primary", width=NULL, collapsible=T,
selectInput("t1p1_dataset", label="Data Set:", choices="Not selected!"),
actionButton("Btn_load_t1p1_dataset", "Load"),
plotOutput("histogram")
)
)
),
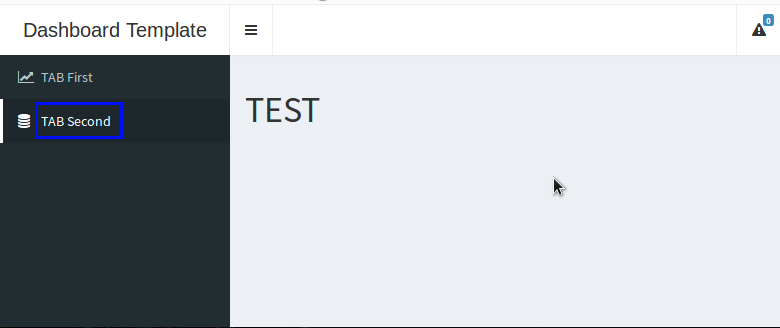
tabItem(tabName="tab02",
h1("TEST")
)
)
)
ui <- dashboardPage( skin="black",
dash_header,
dash_sidebar,
dash_body
)
# Setup ShinyApp Server(back-end) components ------------------------------
server <- function(input, output, session) {
output$histogram <- renderPlot({
hist(faithful$eruptions)
})
}
# Render Shiny app --------------------------------------------------------
shinyApp(ui, server)
