Sankey
trace = go.Sankey(
node=dict(
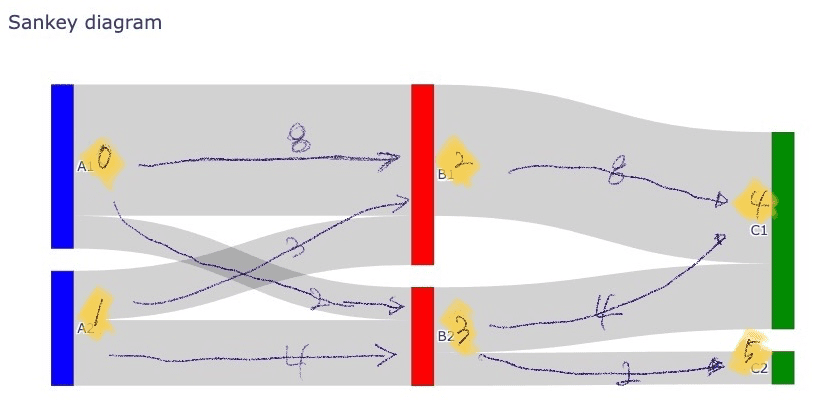
label=["A1", "A2"]+["B1", "B2"]+["C1", "C2"],
# 0 1 2 3 4 5
# thickness=20,
# line=dict(color="black", width=0.5),
# pad=15,
color=["blue"]*2 + ['red']*2 + ['green']*2
),
link=dict(
source=[0, 1, 1, 0, 2, 3, 3],
target=[2, 2, 3, 3, 4, 4, 5],
value= [8, 3, 4, 2, 8, 4, 2]
)
)
layout = go.Layout(title="Sankey diagram")
fig = go.Figure(trace, layout)
fig.show()