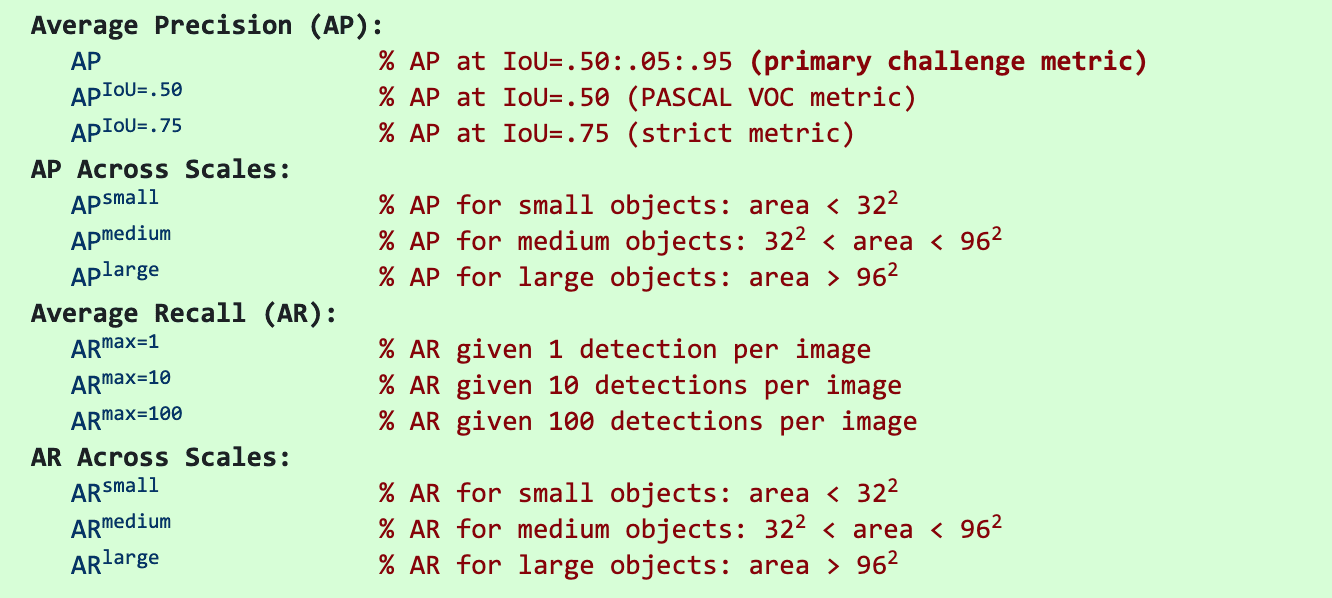
mAP@[0.50:0.95] 의미
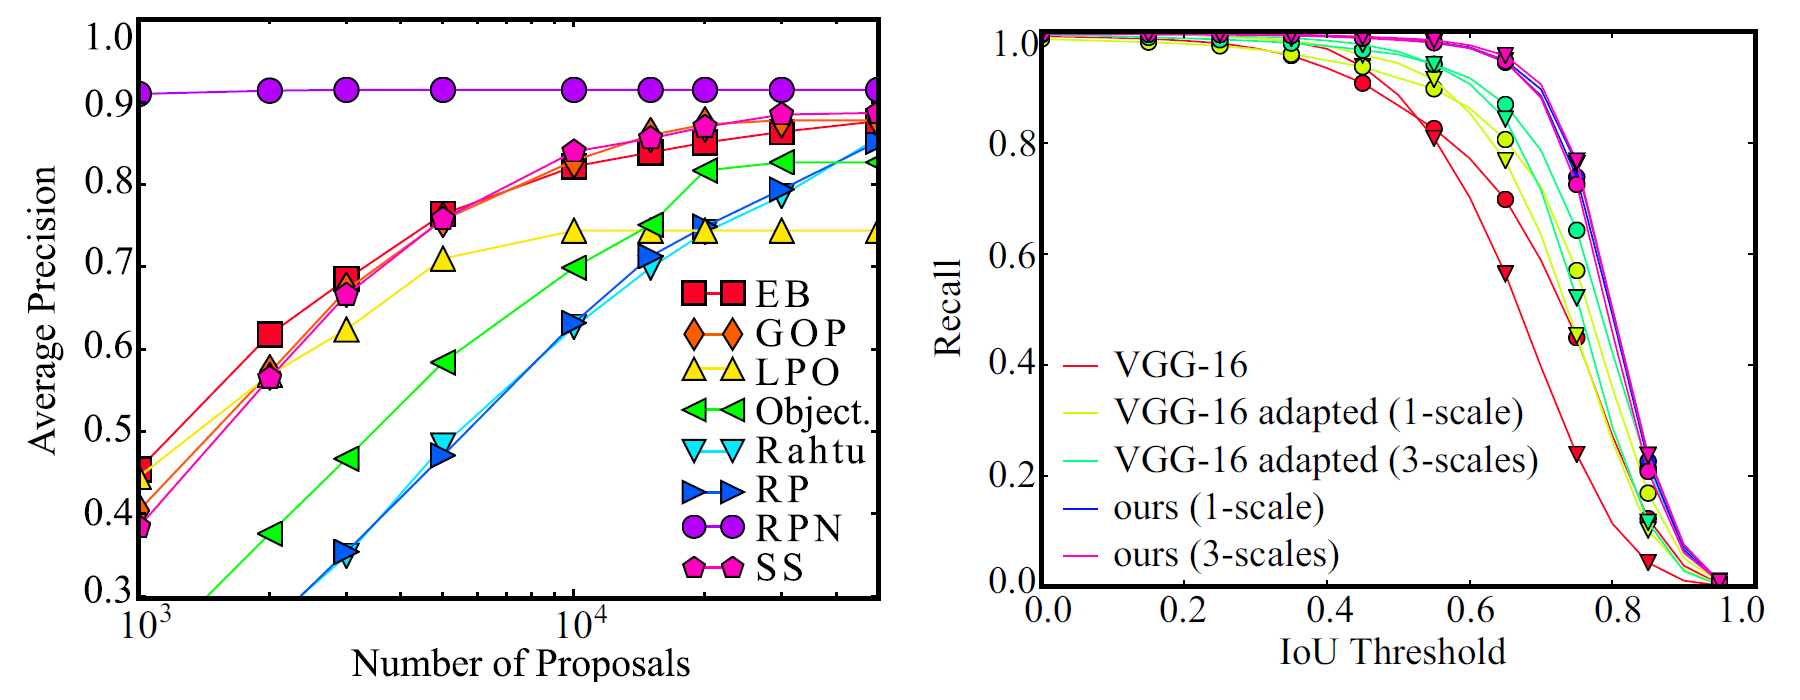
CNN모델의 성능 평가 : mAP
mAP를 이용하여 성능 평가
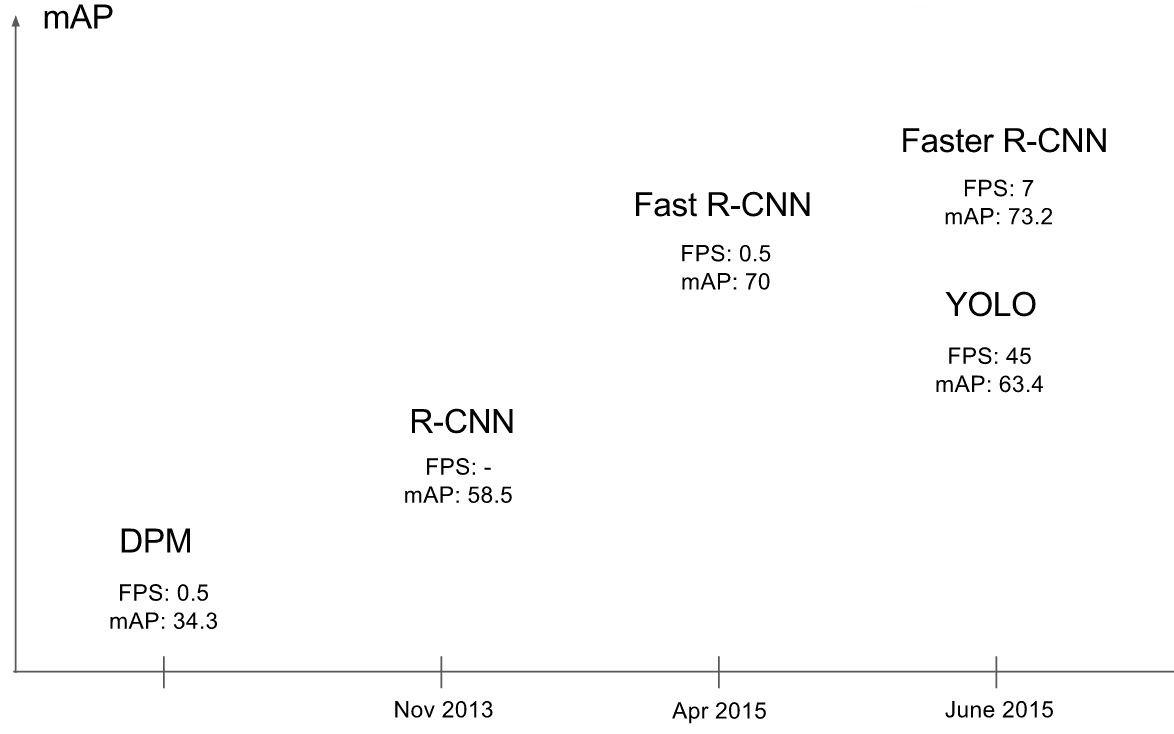
예) 사람을 검출하는 두 모델 중 어떤 모델이 더 좋은가? 검출율:recall 정확도:precision
검출율 99%, 오검출 1장당 10건 vs. 검출율 50%. 오검출 0

https://www.cs.cornell.edu/~sbell/pdf/cvpr2016-ion-bell.pdf
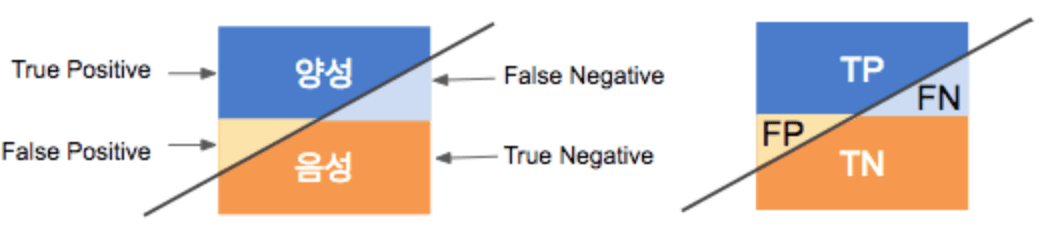
True , False의 기준 : IOU
T: “물체를 옳게 검출되었다.” , F: “물체를 옳게 검출되지 않았다.”를 구분해 주는 기준은
IOU (Intersection over union)
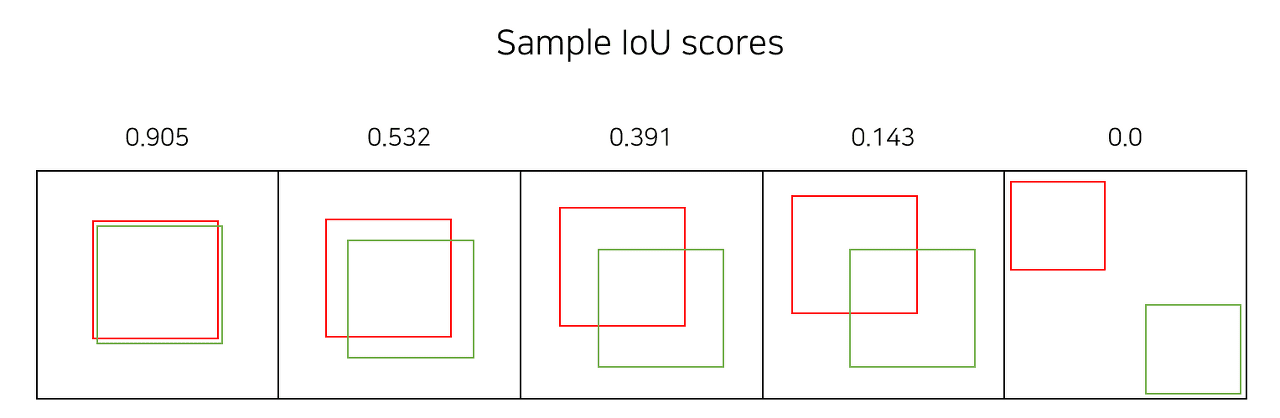
IoU값이 0.5 이상이면 TP(옳게 검출) , 0,5 미만이면 FP (잘못 검출) 라고 판단
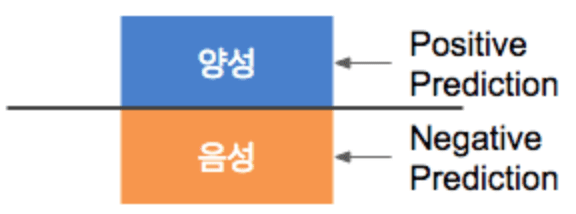
Object Detection 알고리즘 성능평가 기준: Precision vs. Recall
Object detection에는 사실 Negative GT도 Negtive예측도 없다고 생각하는 것이 편하다. 그것은 결과론적인것.
이진분류에서 활용하던 precision과 recall를 차용하여 사용하면서 조금 헷갈리는 부분이다.
Precision (정밀도 (정확도), 모든 검출중 (P라고 예측한 것)중 GT 비율)
vs. Recall (검출율 (재현율), 전체 GT중 P라고 빠짐없이 예측한 비율)
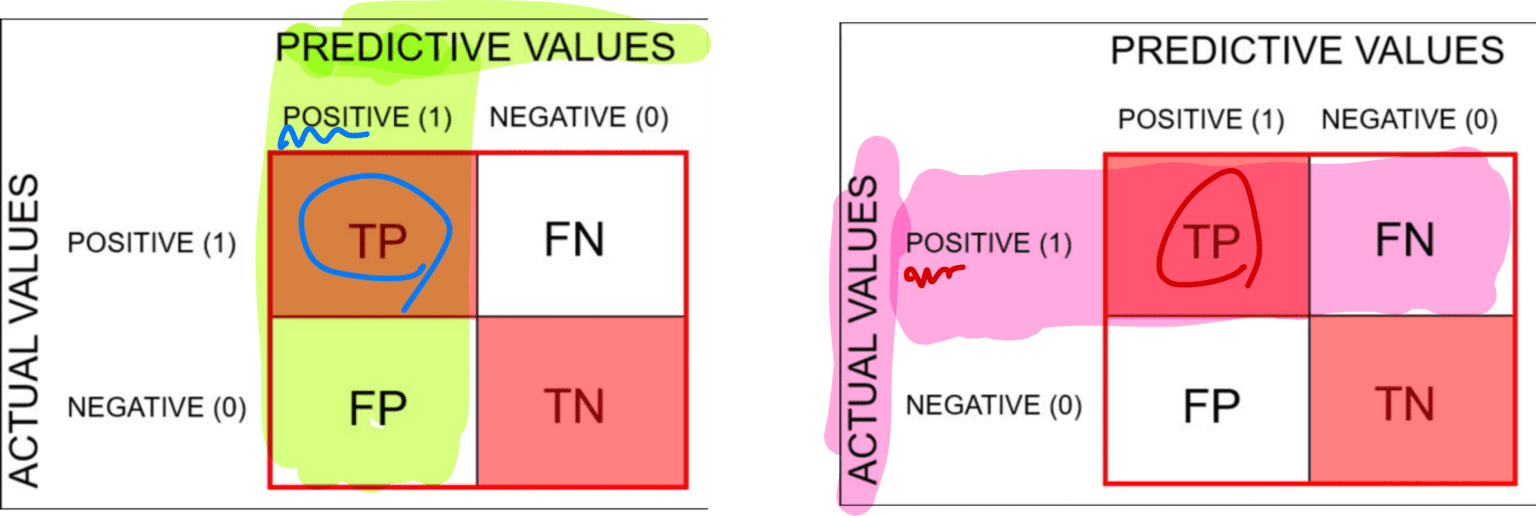
https://onesixx.com/confusion-matrix/
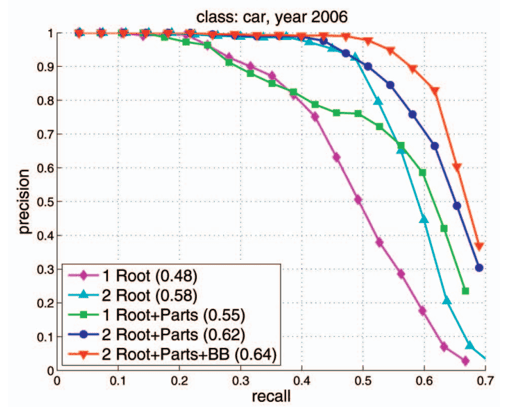
PR Curve (precision recall 곡선)
precision-recall은 서로 반비례 관계이고,
confidence 레벨에 대한 threshold 값의 변화에 따라 precision과 recall 값들이 변화한다.
https://pyimagesearch.com/2022/05/02/mean-average-precision-map-using-the-coco-evaluator/
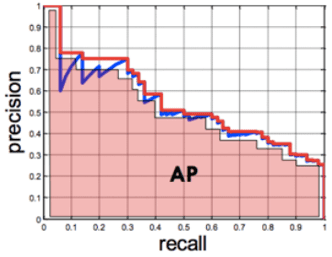
AP (Average Precision)
(파라미터를 낮춰서 검출율(recall)을 높이면 오검출(false alarm)이 증가,
파라미터를 높여 오검출을 줄이면(precision을 높이면), 검출율이 떨어진다.)
따라서 threshold에 따라 알고리즘의 성능평가가 달라진다.
precision-recall 그래프 (반비례 관계) = > AP 그래프
precision-recall 그래프만으로는 하나의 알고리즘의 성능확인하고,
두 알고리즘의 성능비교를 위해서는 AP(Average Precision: 아래면적)를 사용한다.
AP가 높을수록, 알고리즘의 성능이 더 좋다는 의미
For object detection, AP is defined in here.
AU ROC (Area under ROC) =>
– AUC (Area under curve)
– ROC (Receiver Operating Characteristic, 모든 임계값에서 모델성능보여줌)
https://bioinformaticsandme.tistory.com/328
즉, AP라는 것은 precision/recall 곡선을 요약하는 것이므로,
precision뿐만 아니라, recall도 고려되어야 한다.
(그러므로, 단지 Precision을 구할때는 고려되지 않는, FN도 AP에게는 불리하게 적용되어야한다)
 Average Precision  (AP) @[ IoU=0.50:0.95 | area=   all | maxDets=100 ] = 0.061
 Average Precision  (AP) @[ IoU=0.50      | area=   all | maxDets=100 ] = 0.075
 Average Precision  (AP) @[ IoU=0.75      | area=   all | maxDets=100 ] = 0.059

 Average Precision  (AP) @[ IoU=0.50:0.95 | area= small | maxDets=100 ] = 0.000
 Average Precision  (AP) @[ IoU=0.50:0.95 | area=medium | maxDets=100 ] = 0.000
 Average Precision  (AP) @[ IoU=0.50:0.95 | area= large | maxDets=100 ] = 0.094


 Average Recall     (AR) @[ IoU=0.50:0.95 | area=   all | maxDets=  1 ] = 0.099
 Average Recall     (AR) @[ IoU=0.50:0.95 | area=   all | maxDets= 10 ] = 0.099
 Average Recall     (AR) @[ IoU=0.50:0.95 | area=   all | maxDets=100 ] = 0.099

 Average Recall     (AR) @[ IoU=0.50:0.95 | area= small | maxDets=100 ] = 0.000
 Average Recall     (AR) @[ IoU=0.50:0.95 | area=medium | maxDets=100 ] = 0.000
 Average Recall     (AR) @[ IoU=0.50:0.95 | area= large | maxDets=100 ] = 0.14
mAP@[.5, .95])
https://datascience.stackexchange.com/questions/16797/what-does-the-notation-map-5-95-mean
0.50부터 0.95 까지 step이 (0.05)일때,
각 thresholds(임계값 (0.50, 0.55, 0.60, 0.65, 0.70, 0.75, 0.80, 0.85, 0.90, 0.95))에 대해
AP 의 mean(평균)을 구한것
val/mAP_50 vs. val/bbox_mAP_50
https://github.com/open-mmlab/mmdetection/issues/8280
bbox
indicates the outputs of the model are detection results and the code need to calculate the AP and AR for detection.
model의 출력결과는 detection결과를 나타내고, 코드는 AP와 AR을 계산하는데 필요하다.
proposal
indicates the outputs of the model are proposals from RPN (which is only a list of np.ndarray without classes) and the code need to calculate the AR.
detection evaluation metrics used by COCO
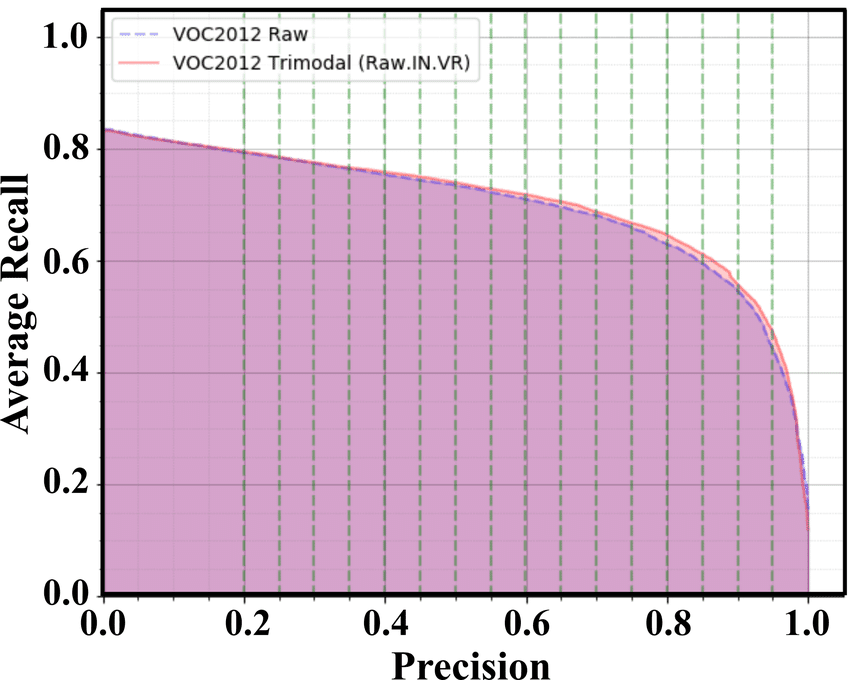
AR (Average recall)
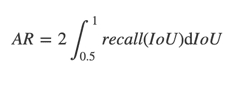
AR은 IoU Threshold 0.5에서 1까지에서 평균 recall을 계산한다.
이것은 단지 특정 IoU에서 recall을 계산하는것이 아니라, IoU Threshold의 전 범위에 대해 recall 분포를 요약하여 나타낸다.
AR은 Recall x IoU 커브 아래 영역의 2배로 나타낼수 있다.
IoU ∈ [0.5,1.0] 에서, x축은 IoU thresholds, y축은 recall
mAP와 비슷하게, mAR은 데이터셋의 모든 Class에 대해 AR 의 평균