matplotlib
개요
https://matplotlib.org/stable/users/explain/quick_start.html
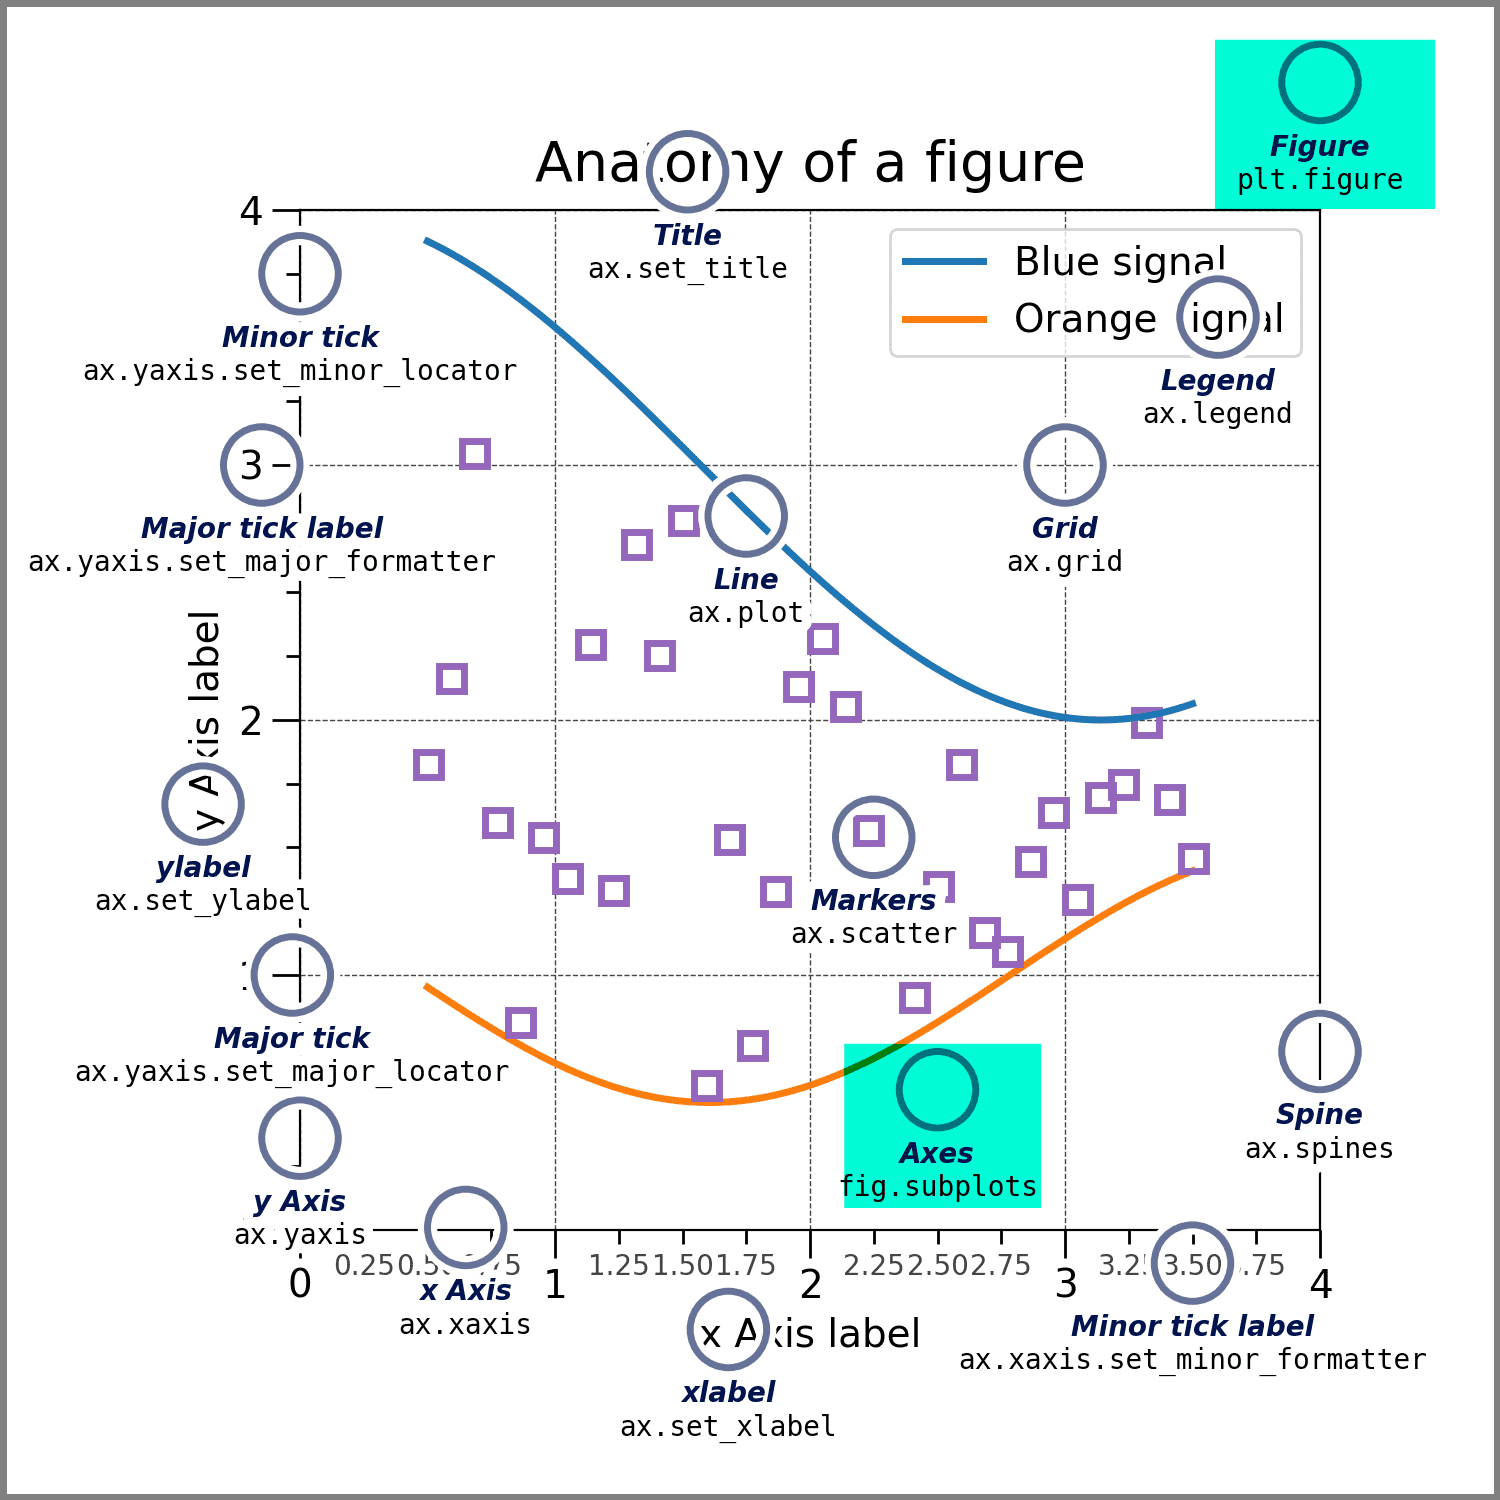
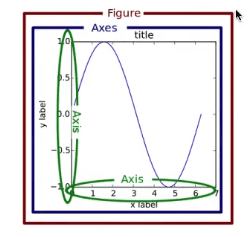
Figure : 액자, 틀
Axes : 컨버스, 그려질 공간
- title
- Axis : 축
- x label
import matplotlib.pyplot as plt
fig = plt.figure() # axes없이 빈 figure
fig, ax = plt.subplots() # single axes의 figure 1
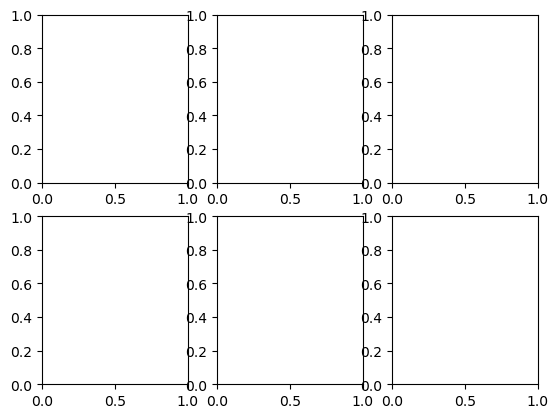
fig, axes = plt.subplots(2,3) # 2*3 gird axes의 figure 2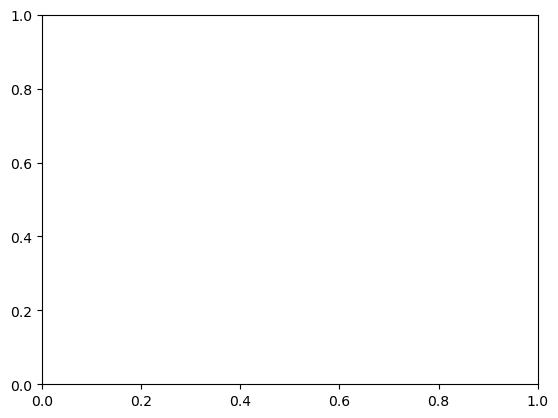
두 가지 방법 – stateless API 사용
출처 :matplotlib 완벽 정리
기존의 plt 기반 그래프 코드를 fig와 ax 객체를 사용하는 방식으로 수정하라.
https://matplotlib.org/stable/users/explain/quick_start.html
fig      = plt.figure()
ax.plot( [1,2,3,4], [1,4,2,3])
fig, ax = plt.subplots()
ax.scatter(mtcars["wt"], mtcars["mpg"])
matplotlib는 아래와 같이 크게 두 가지 방법으로 사용할 수 있습니다.
즉, figure나 ax를 만들지 않음.
x = [ 2,5,7,9]
y = [10,2,7,4]

plt.figure(figsize=(10, 5))
plt.plot(x,y)
plt.xlabel('x')
plt.ylabel('y')
plt.suptitle('Line Plot');
import matplotlib.pyplot as plt
(데이터만 던지고, 내부적으로 암묵적으로 설정됨)
==> 비추, TEST용, 교육용
stateless API (objected-based) :
내가 지정한 figure, 내가 지정한 ax에 그림을 그리는 방법
x = [ 2,5,7,9]
y = [10,2,7,4]

fig, ax=plt.subplots(figsize=(10, 5))
ax.plot(x,y)
ax.set_xlabel('x')
ax.set_ylabel('y')
ax.set_title('Line Plot')
fig, ax를 object로 만들고 해당 변수에 set하는 방식으로
현재의 fig, ax만 사용하고, api를 통해 설정
stateless API (= object oriented) fig,ax
Matplotlib의 component 각각을 Object로 받아, 함수실행/ 속성설정 get/set 하는 방식
=> figure, ax(es)를 우선 생성하고, 하나씩 더해가는 방식
* figure 와 ax 객체를 생성하는 방법
fig = plt.figure() # ax 없는 빈 figure 생성 (후에 ax를 추가해줘야함)

fig, ax = plt.subplots(figsize=(15,10)) # 하나의 ax 만을 가지는 하나의 figure 생성

fig, axes = plt.subplots(nrows=2, ncols=2, figsize=(10,10)) # 4개(2*2)이 ax들을 가지는 하나의 figure 생성
import numpy as np
import pandas as pd
import matplotlib.pyplot as plt
# import seaborn as sns
# sns.set_theme(style="whitegrid")
# Load data
x = np.linspace(-2, 2, 1000)
y1 = np.cos(40 * x)
y2 = np.exp(-x**2)
# 방법1: figure, ax 각각 하나씩만 가지는 그래프 (ax의 색깔 지정 못함)
fig, ax = plt.subplots(figsize=(8, 2.5), facecolor="skyblue")
# # 방법2: 빈 figure를 생성하고 => 그 안에 ax를 추가하기
# fig = plt.figure(figsize=(14, 10), facecolor="red")
# ax = fig.add_axes([0.1, 0.1, 0.8, 0.8], facecolor="blue") # l b w h추가
# 그래프 그리기, 계속 add하며 그릴 수 있음
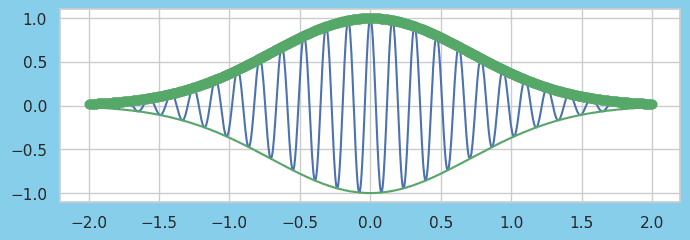
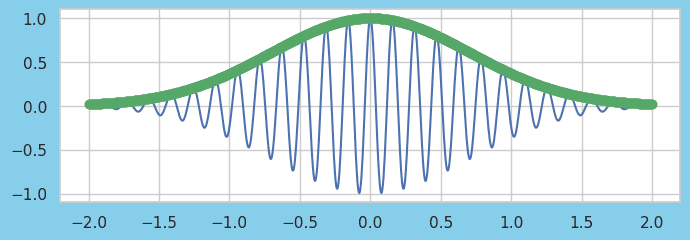
ax.plot(x, y1*y2) # ax 에 plotting
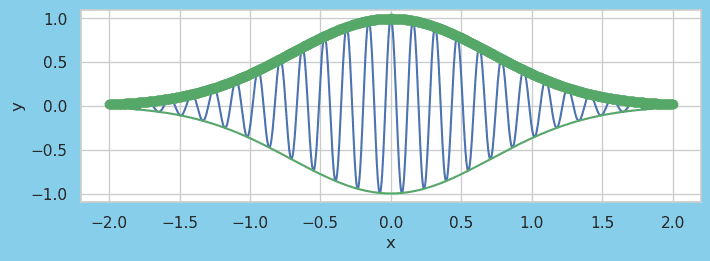
ax.plot(x, y2, 'go--') # 마커 설정 : color: green b r k y , marker: circle o s ^ * + , linestyle: dashed line - -. :
ax.plot(x, -y2, 'g')
ax.set_xlabel("x") # x축 이름 설정
ax.set_ylabel("y") # y축 이름 설정
fig
# ax.plot(x, y1*y2) # ax 에 plotting
# fig
# ax.plot(x, y2, 'go--')
# fig
# ax.plot(x, -y2, 'g')
# fig
# ax.set_xlabel("x") # x축 이름 설정
# ax.set_ylabel("y") # y축 이름 설정
# fig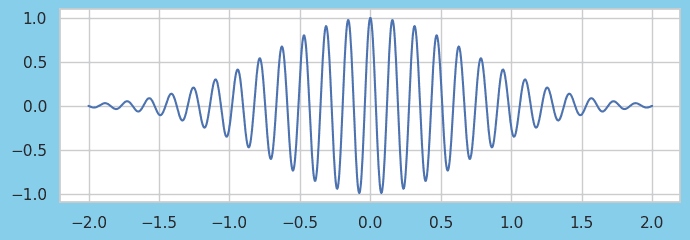
import numpy as np
import pandas as pd
import matplotlib.pyplot as plt
# import seaborn as sns
# sns.set_theme(style="whitegrid")
# Load data
x1 = np.random.randn(100) # 100
x2 = np.random.randn(100) # 100
r = np.linspace(0, 5, 100) # 100
a = 4 * np.pi * r ** 2 # 100 area
v = (4 * np.pi / 3) * r ** 3 # 100 volume
x = np.linspace(0, 50, 500) # 500
y = np.sin(x) * np.exp(-x/10) # 500
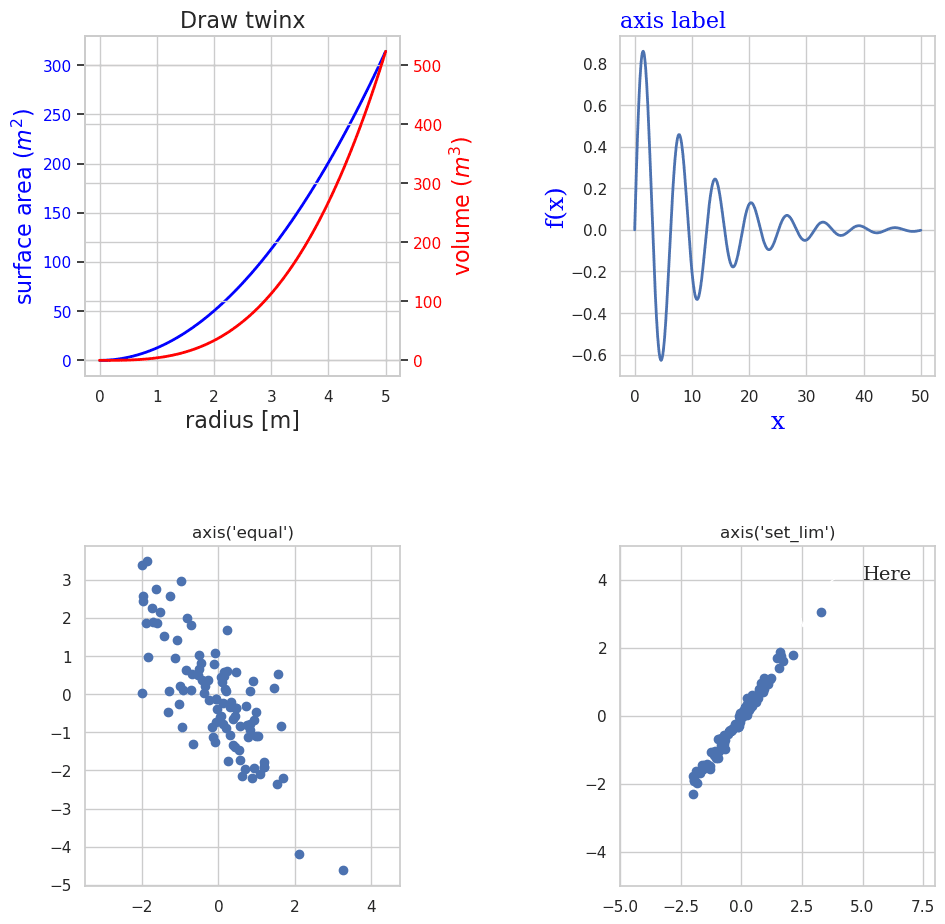
# 여러개의 ax를 가지는 하나의 figure 생성
fig, axes = plt.subplots(2, 2, figsize=(10, 10)) # 4개의 ax를 가진 하나의 figure 생성
# 0,0 ax에 그래프 그리기
axes[0, 0].plot(r, a, lw=2, color="blue") # lw: line width
axes[0, 0].set_title("Draw twinx", fontsize=16) # ax 중에서 0행 0열의 제목 설정
axes[0, 0].set_xlabel("radius [m]", fontsize=16)
axes[0, 0].set_ylabel(r"surface area ($m^2$)", fontsize=16, color="blue") # 수학식을 나타낼대 $ 사이에 넣음
for label in axes[0, 0].get_yticklabels(): # y축 tick 색깔 지정
label.set_color("blue")
ax2 = axes[0, 0].twinx() # 이중축 그리기
ax2.plot(r, v, lw=2, color="red")
ax2.set_ylabel(r"volume ($m^3$)", fontsize=16, color="red")
for label in ax2.get_yticklabels():
label.set_color("red")
# 0,1 ax에 그래프 그리기
axes[0, 1].plot(x, np.sin(x) * np.exp(-x/10), lw=2)
axes[0, 1].set_xlabel("x", labelpad=5, fontsize=18, fontname='serif', color="blue") # label 위치, 색깔, 글꼴 조절
axes[0, 1].set_ylabel("f(x)", labelpad=1, fontsize=18, fontname='serif', color="blue")
axes[0, 1].set_title("axis label", loc='left', fontsize=16, fontname='serif', color="blue") # 제목 왼쪽 정렬
axes[1, 0].set_title("axis('equal')")
# 1,0 ax에 그래프 그리기
axes[1, 0].scatter(x1, -x1 + x2)
axes[1, 0].axis('equal') # x,y축의 범위를 동일하게 하기# 1,1 ax에 그래프 그리기
# subplot 간 간격 조절
https://matplotlib.org/stable/api/_as_gen/matplotlib.pyplot.html
