layout
https://github.com/hong-sj/python/tree/main/code/code-py
import os
import pandas as pd
import numpy as np
from dash import Dash, html, dcc
from dash.dependencies import Input, Output, State
import plotly.graph_objects as go
from plotly.colors import DEFAULT_PLOTLY_COLORS
dash_app = Dash(
name = __name__,
#server = server,
)
server = dash_app.server
dash_app.title = ('Dashboard - Sales data')
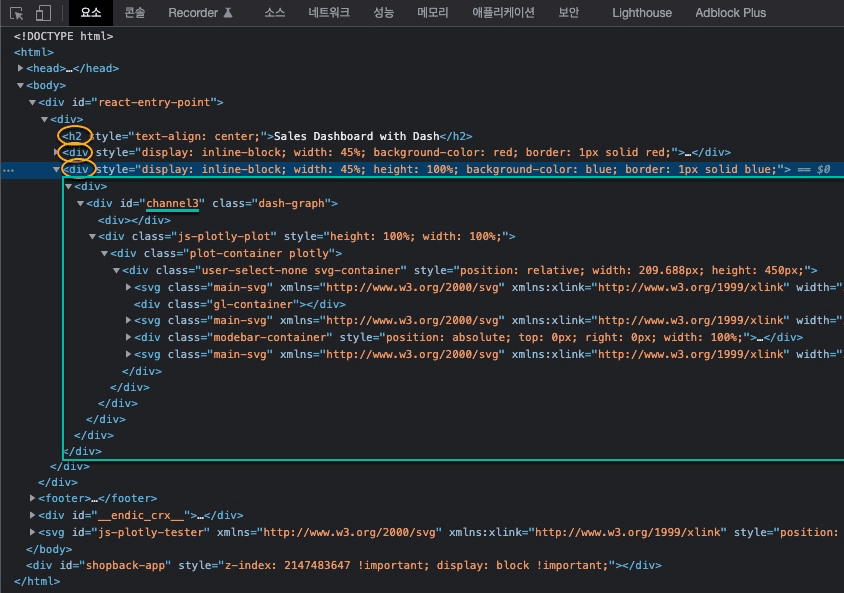
dash_app.layout = html.Div(children=[
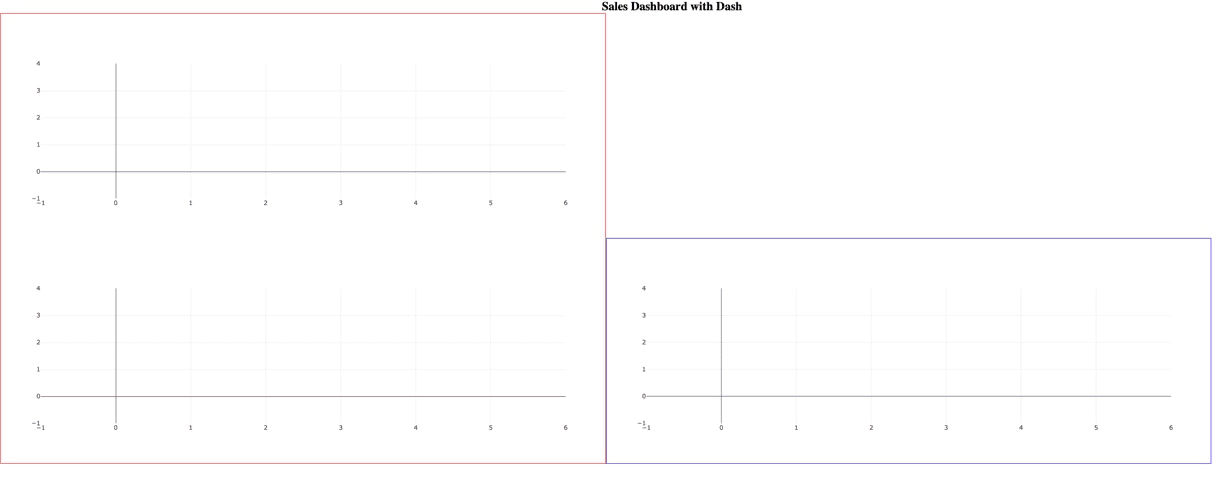
html.H2('Sales Dashboard with Dash', style={'textAlign':'center'}),
# 영역나누기 : 위/아래 , 왼쪽/오른쪽
html.Div(style={'display':'inline-block','width':'45%', 'background-color': 'red', 'border': '1px solid red'},
children=[
html.Div(dcc.Graph(id='channel1')),
html.Div(dcc.Graph(id='channel2'))
]
),
html.Div(style={'display':'inline-block','width':'45%', 'height':'100%', 'background-color': 'blue', 'border': '1px solid blue'},
children=[html.Div(dcc.Graph(id='channel3'))]
),
])
if __name__=='__main__':
dash_app.run_server(debug=False)