interpolation – pracma Published by onesixx 19-12-10 19-12-10
pracma::interp1()
library('pracma') # for interp1()

x <- c(0.8, 0.3, 0.1, 0.6, 0.9, 0.5, 0.2, 0.0, 0.7, 1.0, 0.4)
y <- x^2
dt <- data.table(x=x,y=y)[order(x),]

xi <- seq(0,1,length.out=81)

yl <- interp1(dt$x, dt$y, xi, method="linear")
dt_linear  <- data.table(x=xi, y=yl)

yn <- interp1(dt$x, dt$y, xi, method="nearest")
dt_nearest <- data.table(x=xi, y=yn)

ys <- interp1(x, y, xi, method="spline")
dt_spline  <- data.table(x=xi, y=ys)

p <- NULL %>% ggplot(aes(x=x, y=y))
p <- p + geom_point(data=dt, color="black")
p <- p + geom_line(data=dt_linear, color="blue")
p <- p + geom_line(data=dt_nearest, color="Violet", linetype="dotted")
p <- p + geom_line(data=dt_spline, color="red", linetype="dashed")
p
#ggplotly(p)
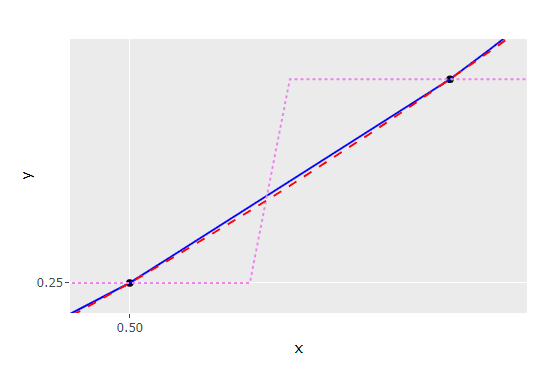
Spline비교 ( Matlab vs. R)
x <- 1:6
y <- c(16, 18, 21, 17, 15, 12)
dt <- data.table(x=x,y=y)[order(x),]

# stats::spline
sp <- spline(x, y, n=51, method="fmm")   # periodic, natural, monoH.FC, hyman
df.fmm <- matrix(unlist(sp), nrow=51, byrow=F) %>% data.table(stringsAsFactors=F)
names(df.fmm) <- c("x", "y")

# pracma::interp1()
xs <- seq(1,6,length.out=51)  # linspace(1, 6, 51)    cf.seq(from, to , by)
ys <- interp1(x, y, xs, method="spline")
dt_spline  <- data.table(x=xs, y=ys)

p <- NULL %>% ggplot(aes(x=x, y=y)) + geom_point()
p <- p + geom_line(data=df.fmm,    aes(color="R"), lwd=.4)
p <- p + geom_line(data=dt_spline, aes(color="M"), lwd=.4, linetype="dashed")
p <- p + theme(legend.position=c(0.8, 0.8)) +
         scale_colour_manual(values=c("blue","red"),
                             name=NULL, label=c("Matlab","R"))
p
#ggplotly(p)
# https://www.r-bloggers.com/interpolation-and-smoothing-functions-in-base-r/
# Generate data in the form of a sine wave
set.seed(1)
n <- 1e3
dat <- data.frame(
  x = 1:n,
  y = sin(seq(0, 5*pi, length.out = n)) + rnorm(n=n, mean = 0, sd=0.1)
)

approxData <- data.table(
  with(dat,
       approx(x, y, xout = seq(1, n, by = 10), method = "linear")
  ),
  method = "approx()", rill=T
)

splineData <- data.frame(
  with(dat,
       spline(x, y, xout = seq(1, n, by = 10))
  ),
  method = "spline()"
)

smoothData <- data.frame(
  x = 1:n,
  y = as.vector(smooth(dat$y)),
  method = "smooth()"
)

loessData <- data.frame(
  x = 1:n,
  y = predict(loess(y~x, dat, span = 0.1)),
  method = "loess()"
)

library(ggplot2)
ggplot(rbind(approxData, splineData, smoothData, loessData), aes(x, y)) +
  geom_point(dat = dat, aes(x, y), alpha = 0.2, col = "red") +
  geom_line(col = "blue") +
  facet_wrap(~method) +
  ggtitle("Interpolation and smoothing functions in R") +
  theme_bw(16)