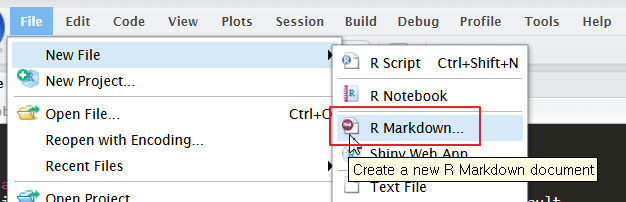
FlexDashboard rmarkdown
http://rmarkdown.rstudio.com/flexdashboard/
cf> ShinyDashboard https://rstudio.github.io/shinydashboard/
cf> tableau https://www.tableau.com
CSS
FlexDashboard
개인적으로 굳이 runtime:shiny 안 쓰고, 단지 flexdashboard만을 사용하여 껍데기를 구성하여(Html 맹글어서 접속하는데 사용하고)
별도의 Shiny App을 embedded하는게 낫지 않을까 싶다.
패키지 설치
> install.packages("flexdashboard")
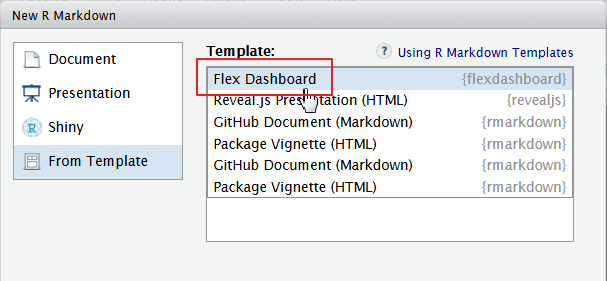
---
title: "Flexboard"
output:
flexdashboard::flex_dashboard:
orientation: rows
vertical_layout: fill
---
```{r global, include=FALSE}
```
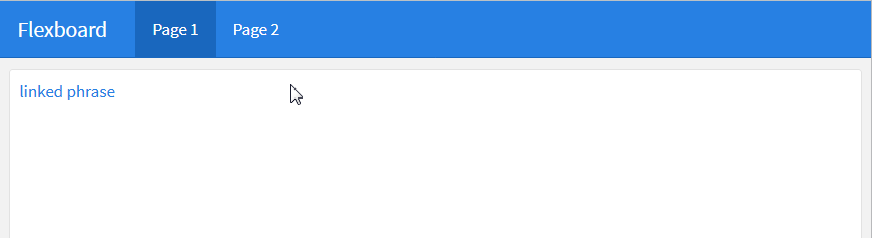
Page 1
===========================================================
[linked phrase](./chapter1.html){target="_blank"}
Page 2
===========================================================
row1 {data-height=90%}
-------------------------------------------------
### Histogram {.no-title}
```{r}
```
row2 {data-height=10%}
-------------------------------------------------
### Description
Hitogram 그리고, row별로 나누기
http://rmarkdown.rstudio.com/formats.html
http://rmarkdown.rstudio.com/flexdashboard/
FlexDashboard 에 Shiny 적용 (runtime: shiny)
http://rmarkdown.rstudio.com/flexdashboard/layouts.html#input_sidebar_(global)
1. Layout
# (======)
## (——)
Single Column (Fill, scroll), Multiple Columns, Multiple Rows
- YAML헤더에
runtime: shiny추가 - 첫번째 Column에
{.sidebar}추가
2. Components
### 이하의 요소들은 모두 컴포넌트 (html widgets, R plot, table, value box, gauge ….)
Output으로 flexdashboard 팩키지의 flex_dashboard함수를 사용한다.
ex1> With Sidebar
https://beta.rstudioconnect.com/jjallaire/shiny-eruptions/
문제점: 상단 메뉴가 변해도 Sidebar가 안 변함.
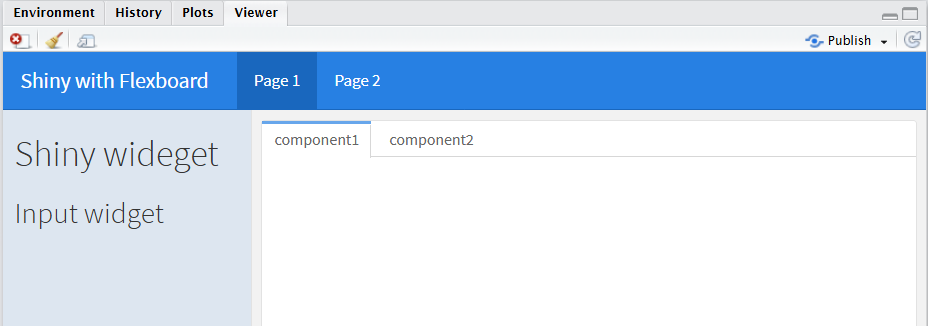
---
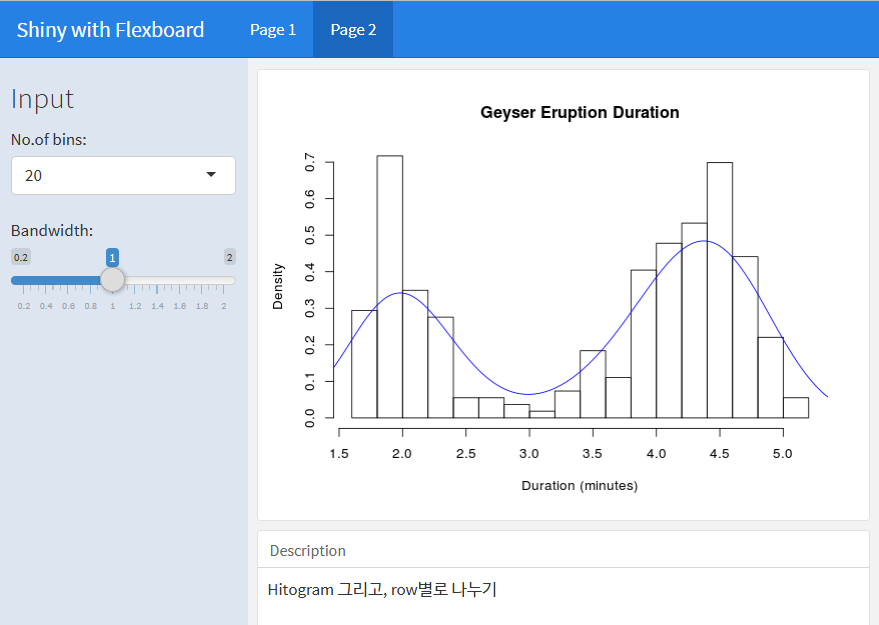
title: "Shiny with Flexboard"
output:
flexdashboard::flex_dashboard:
orientation: rows
runtime: shiny
vertical_layout: fill
---
```{r global, include=FALSE}
library(datasets); data(faithful)
#library(showtext); font.add("myfont","NanumGothic.ttc")
```
Sidebar {.sidebar}
===========================================================
Shiny wideget {.no-title}
-------------------------------------------------
### Input widget {.no-title}
```{r}
selectInput("n_breaks", label = "No.of bins:",
choices = c(10, 20, 35, 50), selected = 20)
sliderInput("bw_adjust", label = "Bandwidth:",
min = 0.2, max = 2, value = 1, step = 0.2)
```
Page 1
===========================================================
TAB {.tabset}
-------------------------------------------------
### component1
```{r}
```
### component2
```{r}
```
Page 2
===========================================================
row1 {data-height=90%}
-------------------------------------------------
### Histogram {.no-title}
```{r}
renderPlot({
hist(faithful$eruptions, probability=T, breaks= as.numeric(input$n_breaks),
xlab="Duration (minutes)", main="Geyser Eruption Duration")
dens <- density(faithful$eruptions, adjust = input$bw_adjust)
lines(dens, col = "blue")
})
```
row2 {data-height=10%}
-------------------------------------------------
### Description
Hitogram 그리고, row별로 나누기
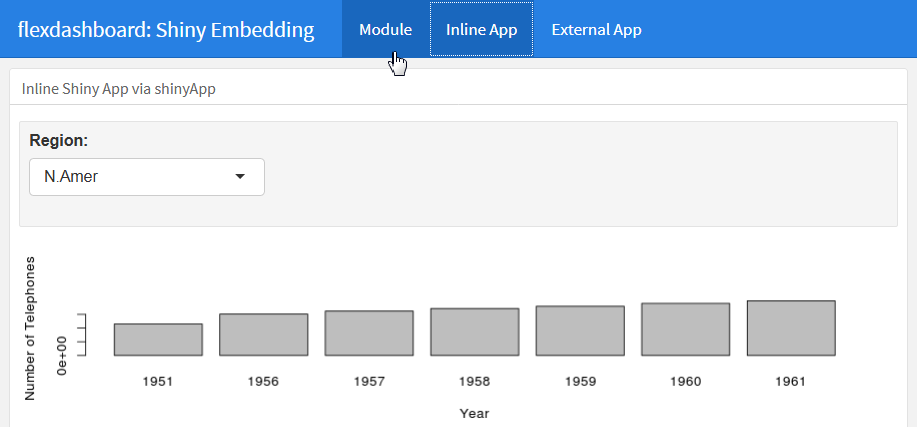
ex2> Without Sidebar, Embeding Shiny
https://beta.rstudioconnect.com/jjallaire/shiny-embedding/
---
title: "flexdashboard: Shiny Embedding"
output:
flexdashboard::flex_dashboard:
#social: menu
source_code: embed
runtime: shiny
---
```{r global, include=FALSE}
library(datasets)
data(WorldPhones)
```
Module
============================================================
### Embedding a Shiny Module
```{r, include=FALSE}
############################################################
##
## Shiny module definition (typically using separate Rscript)
##
############################################################
# UI function
worldPhonesUI <- function(id) {
ns <- NS(id)
fillCol(height = 600, flex = c(NA, 1),
inputPanel(
selectInput(ns("region"), "Region:", choices = colnames(WorldPhones))
),
plotOutput(ns("phonePlot"), height = "100%")
)
}
# Server function
worldPhones <- function(input, output, session) {
output$phonePlot <- renderPlot({
barplot(WorldPhones[,input$region]*1000,
ylab = "Number of Telephones", xlab = "Year")
})
}
```
```{r}
# Include the module
worldPhonesUI("phones")
callModule(worldPhones, "phones")
```
Inline App
=======================================================================
### Inline Shiny App via shinyApp
```{r}
shinyApp(
ui = fillPage(
fillCol(flex = c(NA, 1),
inputPanel(
selectInput("region", "Region:", choices = colnames(WorldPhones))
),
plotOutput("phonePlot", height = "100%")
)
),
server = function(input, output) {
output$phonePlot <- renderPlot({
barplot(WorldPhones[,input$region]*1000,
ylab = "Number of Telephones", xlab = "Year")
})
},
options = list(height = 600)
)
```
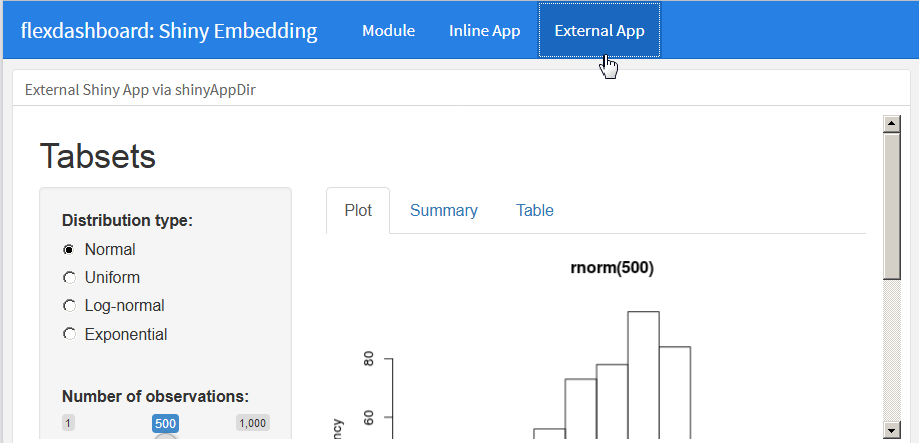
External App
=======================================================================
### External Shiny App via shinyAppDir
```{r}
shinyAppDir(
system.file("examples/06_tabsets", package="shiny"),
options = list(height=850)
)
```
컨터이너의 크기에 맞게, Flexible하게 배치
fillPage(), fillCol(), fillRow()
http://shiny.rstudio.com/articles/gadgets.html
http://shiny.rstudio.com/articles/gadget-ui.html
