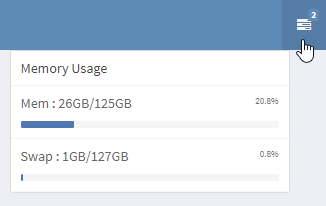
shinyboard :: dropdown notifications menu
library(shiny)
library(shinyjs)
library(shinydashboard)

header  <- dashboardHeader(dropdownMenuOutput("taskMenu"))
sidebar <- dashboardSidebar()
body    <- dashboardBody(useShinyjs())
ui <- dashboardPage(header, sidebar, body)

server <- function(input, output, session) {
  uFunc_memory_info <-  function(){
    mem <- system("free -g", intern=T)
    mem <- str_split(mem, pattern = "\\s{2,}" )
    mem_all  <- as.numeric(mem[[2]][2])
    mem_use  <- as.numeric(mem[[2]][3])
    swap_all <- as.numeric(mem[[3]][2])
    swap_use <- as.numeric(mem[[3]][3])
    #curr_systime <- system("date +%T", intern=T)

    descption1 <- str_c("Mem : ",mem_use,"GB/",mem_all,"GB")
    mem_usage1 <- ((mem_use/mem_all)*100) %>% round(1)
    if (mem_usage1<25) {bar_color1 <- "blue"
    } else if (mem_usage1<50) { bar_color1 <-"green"
    } else if (mem_usage1<75) { bar_color1 <- "red"
    } else {bar_color1 <- "black"}

    descption2 <- str_c("Swap : ",swap_use,"GB/",swap_all,"GB" )
    mem_usage2 <- ((swap_use/swap_all)*100) %>% round(1)
    if (mem_usage2<25) {bar_color2 <- "blue"
    } else if (mem_usage2<50) { bar_color2 <-"green"
    } else if (mem_usage2<75) { bar_color2 <- "red"
    } else {bar_color2 <- "black"}

    taskData1 <- data.frame(text=descption1, value=mem_usage1, color=bar_color1)
    taskData2 <- data.frame(text=descption2, value=mem_usage2, color=bar_color2)
    taskData  <- rbind(taskData1, taskData2)

    mem_row <- apply(taskData, 1, function(row) {
      taskItem(text = row[["text"]],  value = row[["value"]], color = row[["color"]])
    })
    return(mem_row)
  }
  r_val <- reactiveValues(tasklist=0)
  onevent(event="mouseover", id="taskMenu", expr=r_val$task_list<-uFunc_memory_info(), add=FALSE)

  output$taskMenu <- renderMenu({
    dropdownMenu(type = "tasks", headerText="Memory Usage", .list = r_val$task_list)
  })
}

shinyApp(ui, server)
https://github.com/rstudio/shinydashboard/issues/51
## https://github.com/rstudio/shinydashboard/issues/51

library(shiny)
library(shinydashboard)
library(googleVis)

header <- dashboardHeader(
            dropdownMenuOutput("messageMenu"),
            dropdownMenuOutput("notificationMenu"),
            dropdownMenuOutput("taskMenu")
        )
sidebar <- dashboardSidebar(
            sidebarUserPanel("Dave",
              subtitle = a(href="#", icon("circle", class="text-success"), "Online")
            ),
            sidebarMenu(
              menuItem(
                "Dashboard", tabName="dashboard", icon=icon("dashboard") ),
              menuItem(
                "Widgets",   tabName="widgets",   icon=icon("th"), badgeLabel="new", badgeColor="green" )
            )
          )
body <- dashboardBody(
          tabItems(
            tabItem(tabName = "dashboard",
              fluidRow( # infoBoxes with fill=FALSE
                # A static & Dynamic infoBoxes
                infoBox("Demand", 10 * 2, icon = icon("line-chart")),
                infoBoxOutput("progressBox"),
                infoBoxOutput("approvalBox")
              ),
              fluidRow( # infoBoxes with fill=TRUE
                infoBox("Price", 5 * 2, icon = icon("heart"), fill = TRUE),
                infoBoxOutput("progressBox2"),
                infoBoxOutput("approvalBox2")
              ),
              fluidRow(# Clicking this will increment the progress amount
                box(width = 4,
                  actionButton("count", "Increment progress"))
              )
            ),
            tabItem( tabName = "widgets",
              fluidRow(
                box(
                  plotOutput("plot1", height = 250)),
                box(title = "Controls",
                  sliderInput("slider", "Number of observations:", 1, 100, 50))
              )
            )
          )
        )
ui <- dashboardPage(header, sidebar, body)

server <- function(input, output, session) {
  set.seed(122)
  histdata <- rnorm(500)

  txtdata <- "type	        from	  message	            status	color	  value
              message	      1	      message_body	      danger	red	    1
              notification	2	      notification_body	  warning	blue	  2
              task	        3	      task_body	          info	  yellow	3"
  menu.df <- read.table(textConnection(txtdata), header = TRUE)
  closeAllConnections()

  #partition menu data into message, notification, and task
  messageData      <- subset(menu.df, type=="message")
  notificationData <- subset(menu.df, type=="notification")
  taskData         <- subset(menu.df, type=="task")

  output$messageMenu <- renderMenu({
    msgs <- apply(messageData, 1, function(row) {
      messageItem(from = row[["from"]], message = row[["message"]])
    })
    dropdownMenu(type = "messages", .list = msgs)
  })

  output$notificationMenu <- renderMenu({
    nots <- apply(notificationData, 1, function(row) {
      notificationItem(text = row[["message"]], status = row[["status"]])
    })
    dropdownMenu(type = "notifications", .list = nots)
  })

  output$taskMenu <- renderMenu({
    taks <- apply(taskData, 1, function(row) {
      taskItem(text = row[["message"]], color = row[["color"]], value = row[["value"]])
    })
    dropdownMenu(type = "tasks", .list = taks)
  })

  datasetInput <- reactive({
    switch( input$dataset,
      "rock"     = rock,
      "pressure" = pressure,
      "cars"     = cars
    )
  })

  output$view <- renderGvis({
    gvisScatterChart(dropDownMenus, options = list(width = 400, height = 450))
  })

  output$plot1 <- renderPlot({
    data <- histdata[seq_len(input$slider)]
    hist(data)
  })

  output$plot2 <- renderPlot({
    data <- histdata[seq_len(input$slider)]
    hist(data)
  })

  output$progressBox <- renderInfoBox({
    infoBox( "Progress", paste0(25 + input$count, "%"), icon = icon("list"), color = "purple")
  })

  output$approvalBox <- renderInfoBox({
    infoBox("Confidence", "80%", icon = icon("eye-open", lib = "glyphicon"), color = "yellow")
  })

  # Same as above, but with fill=TRUE
  output$progressBox2 <- renderInfoBox({
    infoBox("Managed Spend (mil)", paste0("USD ", 25 + input$count), icon = icon("dollar"), color = "purple", fill = TRUE)
  })
  output$approvalBox2 <- renderInfoBox({
    infoBox("Model Performance", "80%", icon = icon("thumbs-up", lib = "glyphicon"), color = "green", fill = TRUE)
  })
}

shinyApp(ui, server)
