dcc.store
https://dash.plotly.com/dash-core-components
dcc.store
https://dash.plotly.com/dash-core-components/store
https://dash.plotly.com/sharing-data-between-callbacks
https://github.com/sixxchung/Dash-by-Plotly
브라우저에 JSON 저장할때 사용
서버의 부담을 줄이고, Callback간에 데이터를 공유하기 위해
https://www.youtube.com/watch?v=dLykSQNIM1E
https://github.com/Coding-with-Adam/Dash-by-Plotly/tree/master/Dash%20Components/Store
일반적으로 2MB 까지 안전하게 보관가능하고, (데스크탑만 사용한다고 한다면 5~10MB )
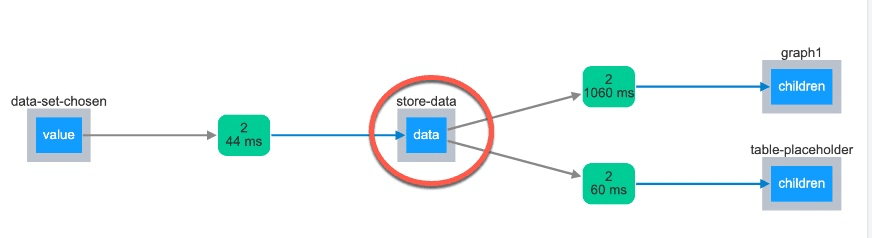
ex> dropdown(data-set-chosen)에 따라 , 데이터셋(store-data)이 바뀌고,
그에 따라 그래프(graph1)와 테이블(table-placeholder)가 표시된다.
from dash import Dash, html, dcc, Output, Input, callback, dash_table
import pandas as pd
import plotly.express as px
import sys
external_stylesheets = ['https://codepen.io/chriddyp/pen/bWLwgP.css']
app = Dash(__name__, external_stylesheets=external_stylesheets)

app.layout = html.Div([
    html.H1('Sharing Data between callbacks', style={'textAlign':'center'}),

    html.Div([
        dcc.Dropdown(id='data-set-chosen', multi=False, value='gapminder',
                     options=[{'label':'Country Data', 'value':'gapminder'},
                              {'label':'Restaurant Tips', 'value':'tips'},
                              {'label':'Flowers', 'value':'iris'}])
    ], className='row', style={'width':'50%'}),

    html.Div([
        html.Div(id='graph1', children=[], className='six columns'),
    ], className='row'),

    html.Div([
        html.Div(id='table-placeholder', children=[])
    ], className='row'),

    # dcc.Store inside the user's current browser session
    dcc.Store(id='store-data', data=[], storage_type='memory') # 'local' or 'session'
])


@callback(
    Output('store-data', 'data'),
    Input('data-set-chosen', 'value')
)
def store_data(value):
    # hypothetical enormous dataset with millions of rows
    if value == 'gapminder':
        dataset = px.data.gapminder()
    elif value == 'tips':
        dataset = px.data.tips()
    elif value == 'iris':
        dataset = px.data.iris()

    print(f" {sys.getsizeof(dataset.to_dict('records'))} bytes")
    return dataset.to_dict('records')
    # 2. or save as string like JSON
    # return dataset.to_json(orient='split')


@callback(
    Output('graph1', 'children'),
    Input('store-data', 'data')
)
def create_graph1(data):
    print(type(data))
    dff = pd.DataFrame(data)
    # 2. convert string like JSON to pandas dataframe
    # dff = pd.read_json(data, orient='split')
    print(dff.head())
    print(type(dff))

    if 'country' in dff.columns:
        fig1 = px.line(dff, x='year', y='lifeExp', color='continent')
        return dcc.Graph(figure=fig1)

    elif 'total_bill' in dff.columns:
        fig2 = px.bar(dff, x='day', y='tip', color='sex')
        return dcc.Graph(figure=fig2)

    elif 'sepal_length' in dff.columns:
        fig3 = px.scatter(dff, x='sepal_width', y='petal_width', color='species')
        return dcc.Graph(figure=fig3)


@callback(
    Output('table-placeholder', 'children'),
    Input('store-data', 'data')
)
def create_graph1(data):
    dff = pd.DataFrame(data)
    # 2. convert string like JSON to pandas dataframe
    # dff = pd.read_json(data, orient='split')
    my_table = dash_table.DataTable(
        columns=[{"name": i, "id": i} for i in dff.columns],
        data=dff.to_dict('records')
    )
    print(f"sixx==> {type(my_table)}")
    return my_table

if __name__ == '__main__':
    app.run_server(debug=True)
얼마나 오랬동안 데이터가 유지되는지에 따라
memory : refresh될때까지 , 가장 짧은 시간동안 저장됨
seession : 브라우저를 종료하거나 탭을 닫을때까지
Local : 브라우저 쿠키같은 곳에 저장되어
