Data-driven prediction of battery cycle life before capacity degradation
s/g/files/sbiybj9971/f/346501527888d799d94279cfe74049fde53ca2d5a1275d083d28f925253cf657.pdf
https://doi.org/10.1038/s41560-019-0356-8
https://github.com/rdbraatz/data-driven-prediction-of-battery-cycle-life-before-capacit
y-degradation
https://www.nature.com/articles/s41560-019-0356-8
https://energy.stanford.edu/site
용량 저하전 battery cycle-life (데이터 기반) 예측
(복잡하고 nonlinear한) 리튬이온배터리의 정확한 수명(lifetime) 예측은 배터리의 기술적발전에 중요하다.
하지만, 다양한 aging machanisms, 중요한 device 변동성, dynamic한 구동환경은 여전히 예측을 어렵게 한다.
- 데이터: lithium iron phosphate/ graphite cells (인산/흑연으로 구성된 상용 배터리) 124개
A123 lithium-ion phosphate (LFP)/graphite cells (APR18650M1A)
nominal capacity of 1.1 Ah
nominal voltage of 3.3 V. - 조건: fast-charging
150 to 2,300 cycles 의 변동성을 갖는
48-channel Arbin LBT potentiostat
용량저하(capacity degradation)를 보여주기 위해 early cycle로부터 discharge voltage 곡선을 이용해서,
cycle life에 따라 cell을 분류/ 예측해 보았다.
첫 100 cycles을 사용해서 cycle life를 예측 모델은 9.1% test error를 나타냈다.
(초기용량보다 0.2% median 증가를 보여준다.)
첫 5 cycles을 사용해서 cycle life를 2개의 group으로 분류하는 모델은 4.9% test error를 나타냈다.
복잡하고 변화가 많은 cell의 행동패턴을 계획적으로 만들어낸 데이터를 조합을 통해 모델링할 수 있다는 가능성을 엿볼수 있었다.
리튬이온배터리의 수명의 예측은 매우 중요하지만, 어려운 문제이다.
cycle에 따라 비선형적인 수명저하와 큰 변동성은 심지어 잘 관리된 실험환경에서도 동일하게 나타난다.
리튬이온배터리는 아래의 이유로 많은 곳에 사용되고 있다.
– 낮은 가격
– 높은 에너지 밀도
– 긴 수명 => 긴 시간을 들여야, performance에 대한 feedback을 받을 수 있기 때문에 실험이 쉽지 않다.
정확한 early-cycle 데이터를 활용한 정확한 수명(lifetime)의 예측은 배터리생산/ 사용/ 최적화에 새로운 기회를 열어줄지도 모른다.
– 제조사”: 셀 개발 주기를 가속화할 수 있고, 새 제조 프로세스를 빠르게 검증할수 있고, 기대수명에 따라 새로운 cell의 등급을 메길수 있다.
– 최종사용자 : battery life expectancy 를 추정할수 있다.
초기예측(early prediction)을 통해 가능해진 최근 부각되는 방법은
process의 많은 parameter 공간에 걸친 process들의 최대수율 최적화(high-throughput optimization)이다.
예를 들어, multistep fast charging 과 (아주 긴 시간이 필요해서 다루기 힘들었던) formation cycling 같은 프로세스들.
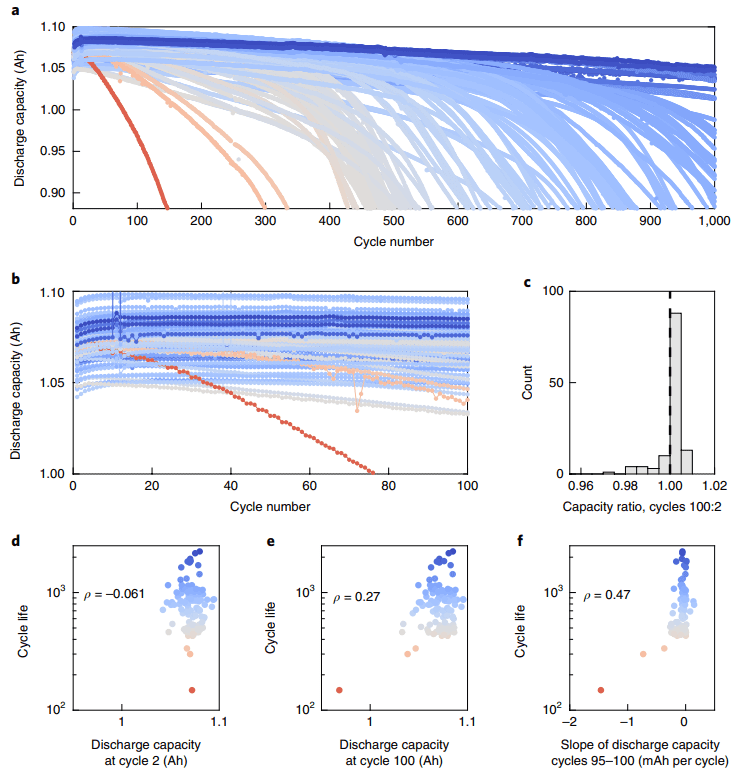
Fig. 1 | 초기 100 cycle에서 discharge capacity 기반의 feature를 사용하여 예측한 모델은 성능이 좋지 못했다.
a, Discharge capacity for the first 1,000 cycles of LFP/ graphite cells.
The colour of each curve is scaled by the battery’s cycle life, as is done throughout the manuscript.
b, A detailed view of a, showing only the first 100 cycles. A clear ranking of cycle life has not emerged by cycle 100.
c, Histogram of the ratio between the discharge capacity of cycle 100 and that of cycle 2. The cell with the highest degradation (90%) is excluded to show the detail of the rest of the distribution. The dotted line indicates a ratio of 1.00. Most cells have a slightly higher capacity at cycle 100 relative to cycle 2.
d, Cycle life as a function of discharge capacity at cycle 2. The correlation coefficient of capacity at cycle 2 and log cycle life is −0.06 (remains unchanged on exclusion of the shortest-lived battery).
e, Cycle life as a function of discharge capacity at cycle 100. The correlation coefficient of capacity at cycle 100 and log cycle life is 0.27 (0.08 excluding the shortest-lived battery).
f, Cycle life as a function of the slope of the discharge capacity curve for cycles 95–100. The correlation coefficient of this slope and log cycle life is 0.47 (0.36 excluding the shortest-lived battery).
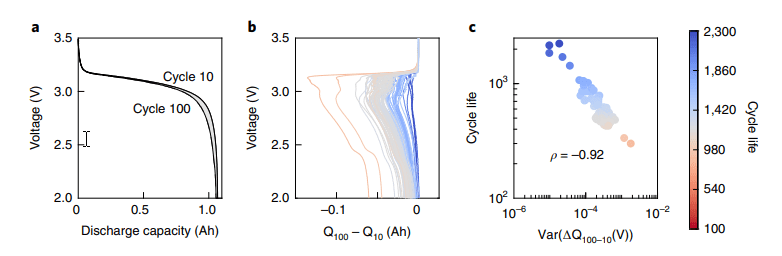
Fig. 2 | High performance of features based on voltage curves from the first 100 cycles. a, Discharge capacity curves for 100th and 10th cycles for a representative cell. b, Difference of the discharge capacity curves as a function of voltage between the 100th and 10th cycles, ΔQ100-10(V), for 124 cells. c, Cycle life plotted as a function of the variance of ΔQ100-10(V) on a log–log axis, with a correlation coefficient of −0.93. In all plots, the colours are determined based on the final cycle lifetime. In c, the colour is redundant with the y-axis. In b and c, the shortest lived battery is excluded.
Many previous studies have modelled lithium-ion battery lifetime
Power와 capacity loss를 예측하는
아래와 같은 다양한 메카니즘을 설명하는 physical 하고 semi-empirical 실증적인 모델들..
growth of the solid–electrolyte interphase
lithium plating
active material loss
impedance increase
Specialized diagnostic measurements ( coulombic efficiency 나 impedance spectroscopy )도 수명예측에 사용될수 있다.
이런 화학적 or 매카니즘적인 모델은 성공적인 예측을 했지만, fast charging같은 운영조건하에서 full cells cycled한 모델 개발은 아직도 도전적인 과제이다.
특히, 많은 저하 요소와 온도와 제조과정에서 품질이 다른 cell 간의 결합하에서…
ML을 통해
– prediction of material properties
– identification of chemical synthesis routes
– material discovery for energy storage and catalysis
Accurate early prediction of cycle life with significantly less degradation is challenging because of the typically nonlinear degradation process (with negligible capacity degradation in early cycles) as well as the relatively small datasets used to date that span a limited range of lifetimes49. For example, Harris et al.10 found a weak correlation (ρ=0.1) between capacity values at cycle 80 and capacity values at cycle 500 for 24 cells exhibiting nonlinear degradation profiles, illustrating the difficulty of this task. Machine-learning approaches are especially attractive for high-rate operating conditions, where first-principles models of degradation are often unavailable. In short, opportunities for improving upon state-of-the-art prediction models include higher accuracy, earlier prediction, greater interpretability and broader application to a wide range of cycling conditions.
아주 적게 저하된 cycle life의 정확한 early prediction 은
\
In this work, we develop data-driven models that accurately predict the cycle life of commercial lithium iron phosphate (LFP)/ graphite cells using early-cycle data, with no prior knowledge of degradation mechanisms. We generated a dataset of 124 cells with cycle lives ranging from 150 to 2,300 using 72 different fast-charging conditions, with cycle life (or equivalently, end of life) defined as the number of cycles until 80% of nominal capacity. For quantitatively predicting cycle life, our feature-based models can achieve prediction errors of 9.1% using only data from the first 100 cycles, at which point most batteries have yet to exhibit capacity degradation. Furthermore, using data from the first 5 cycles, we demonstrate classification into low- and high-lifetime groups and achieve a misclassification test error of 4.9%. These results illustrate the power of combining data generation with data-driven modelling to predict the behaviour of complex systems far into the future.
Data generation
We expect the space that parameterizes capacity fade in lithiumion batteries to be high dimensional due to their many capacity fade mechanisms and manufacturing variability. To probe this space, commercial LFP/graphite cells (A123 Systems, model APR18650M1A, 1.1Ah nominal capacity) were cycled in a temperature-controlled environmental chamber (30 °C) under varied fast-charging conditions but identical discharging conditions (4C to 2.0V, where 1C is 1.1A; see Methods for details). Since the graphite negative electrode dominates degradation in these cells, these results could be useful for other lithium-ion batteries based on graphite32,50–54. We probe average charging rates ranging from 3.6C, the manufacturer’s recommended fast-charging rate, to 6C to probe the performance of current-generation power cells under extreme fast-charging conditions (~10min charging), an area of significant commercial interest55. By deliberately varying the charging conditions, we generate a dataset that captures a wide range of cycle lives, from approximately 150 to 2,300 cycles (average cycle life of 806 with a standard deviation of 377). While the chamber temperature is controlled, the cell temperatures vary by up to 10 °C within a cycle due to the large amount of heat generated during charge and discharge. This temperature variation is a function of internal impedance and charging policy (Supplementary Figs. 3 and 4).
Voltage, current, cell can temperature and internal resistance are continuously measured during cycling (see Methods for additional experimental details). The dataset contains approximately 96,700 cycles; to the best of the authors’ knowledge, our dataset is the largest publicly available for nominally identical commercial lithium-ion batteries cycled under controlled conditions (see Data availability section for access information). Fig. 1a,b shows the discharge capacity as a function of cycle number for the first 1,000 cycles, where the colour denotes cycle life. The capacity fade is negligible in the first 100 cycles and accelerates near the end of life, as is often observed in lithium-ion batteries. The crossing of the capacity fade trajectories illustrates the weak relationship between initial capacity and lifetime; indeed, we find weak correlations between the log of cycle life and the discharge capacity at the second cycle (ρ=−0.06, Fig. 1d) and the 100th cycle (ρ=0.27, Fig. 1e), as well as between the log of cycle life and the capacity fade rate near cycle 100 (ρ=0.47, Fig. 1f). These weak correlations are expected because capacity degradation in these early cycles is negligible; in fact, the capacities at cycle 100 increased from the initial values for 81% of cells in our dataset (Fig. 1c). Small increases in capacity after a slow cycle or rest period are attributed to charge stored in the region of the negative electrode that extends beyond the positive electrode56,57. Given the limited predictive power of these correlations based on the capacity fade curves, we employ an alternative data-driven approach that considers a larger set of cycling data including the full voltage curves of each cycle, as well as additional measurements including cell internal resistance and temperature.
internal impedance and charging policy
options(scipen=666, digits=10, max.print=666)

library("readxl")
library("fst")
library("plotly")

library("zoo")
library("Deriv")

BASE_PATH="~/DATA/battery/WEB/"    #my room
#WORK_PATH="~/Battery/"

dd <- read_csv(str_c(BASE_PATH,"2017-05-12_6C-40per_3_6C_CH34.csv")) %>% data.table()
names(dd)[13] <- "dVdt"
dd1 <- dd[, c(1:6,8,13)] 