dash0.
Dash APP = Layout(HTML:구조/배치, Core:그래프/인터액티브) + Callback (Input/Output)
https://dash.plotly.com/
https://crong-dev.tistory.com/category/Dash%20Plotly
# -*- coding: utf-8 -*-

# Run this app with `python app.py` and
# visit http://127.0.0.1:8050/ in your web browser.
from sixx import *
print("Hello dash")

import dash
import dash_core_components as dcc
import dash_html_components as html
import pandas as pd
import plotly.express as px

external_stylesheets = ['https://codepen.io/chriddyp/pen/bWLwgP.css']

app = dash.Dash(
    __name__,
    external_stylesheets=external_stylesheets
)

def generate_table(dataframe, max_rows=10):
    return html.Table([
        html.Thead(
            html.Tr([
                html.Th(col) for col in dataframe.columns
            ])
        ),
        html.Tbody([
            html.Tr([
                html.Td(
                    dataframe.iloc[i][col]
                ) for col in dataframe.columns
            ]) for i in range(min(len(dataframe), max_rows))
        ])
    ])

# assume you have a "long-form" data frame
# see https://plotly.com/python/px-arguments/ for more options
# df = pd.DataFrame({
#     "Fruit": ["Apples", "Oranges", "Bananas", "Apples", "Oranges", "Bananas"],
#     "Amount": [4, 1, 2, 2, 4, 5],
#     "City": ["SF", "SF", "SF", "Montreal", "Montreal", "Montreal"]
# })
df = pd.read_csv('https://gist.githubusercontent.com/chriddyp/5d1ea79569ed194d432e56108a04d188/raw/a9f9e8076b837d541398e999dcbac2b2826a81f8/gdp-life-exp-2007.csv')

fig = px.scatter(df,
        x="gdp per capita", y="life expectancy",
        size="population", size_max=60, color="continent",
        hover_name="country", log_x=True)

app.layout = html.Div(children=[
    html.H1('''
        Hello Dash
    '''),

    html.Div('''
        #Dash: A web application framework for Python.
    '''),

    dcc.Graph(id='example-graph',
        figure=fig
    ),
    html.H4(children='US Agriculture Exports (2011)'),
    generate_table(df)
])

if __name__ == '__main__':
    app.run_server(debug=True)
dcc
편의를 위해 component (그래프, 슬라이더, 여러 컨트롤) 제공
import dash_core_components as dcc
help(dcc.Dropdown)
callback
사용자의 입력에 따라 반응하는 App개발을 위해
dash.dependencies.Input 객체 ==> Callback에서 사용
cf> dash_core_components.Input 객체 ==> 실제 component
# -*- coding: utf-8 -*-
from sixx import *
import dash
import dash_core_components as dcc
import dash_html_components as html
from dash.dependencies import Input, Output, State

import pandas as pd
import plotly.express as px

external_stylesheets = ['https://codepen.io/chriddyp/pen/bWLwgP.css']
app = dash.Dash(
    __name__,
    external_stylesheets=external_stylesheets
)

app.layout = html.Div([
    html.Div(["Input: ", dcc.Input(id='my-input', value='initial value', type='text')]),
    html.Br(),
    # Children 없음, Children값 설정해도 callback값으로 초기화 됨
    html.Div(id='my-output'), #children='FUXXX'),
])

@app.callback(
    Output(component_id='my-output', component_property='children'),
    Input('my-input', 'value')
)
def whateverName_update_div(inputVal):
    return 'Result: {}'.format(inputVal)

if __name__ == '__main__':
    app.run_server(debug=True)
Multi-Input
app.layout = html.Div([
    dcc.Input(id="my-input1", type="text", value="Seoul"),
    dcc.Input(id="my-input2", type="text", value="Canada"),
    html.Div(id="my-output"),
])

@app.callback(
    Output('my-output', 'children'),
    Input('my-input1', 'value'),
    Input('my-input2', 'value')
)
def whateverName_update_div(inputVal1,inputVal2 ):
    return 'Result: 1.{}, 2.{}'.format(inputVal1, inputVal2)
State
결과(출력)값에는 사용되지만, 값이 변할 때 자동으로 콜백함수를 호출하고 싶지 않은 경우
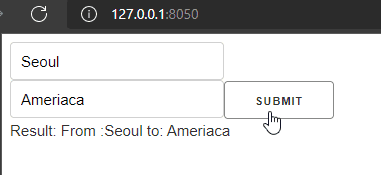
app.layout = html.Div([
    dcc.Input(id="my-input1", type="text", value="Seoul"),html.Br(),
    dcc.Input(id="my-input2", type="text", value="Canada"),
    html.Button(id="btn_submit", n_clicks=0, children='submit'),
    html.Div(id="my-output"),
])

@app.callback(
    Output('my-output', 'children'),
    Input('btn_submit', 'n_clicks'),
    State('my-input1', 'value'),
    State('my-input2', 'value')
)
def whateverName_update_div(Input_nclicks, stateVal1, stateVal2 ):
    return 'Result: From :{}  to: {}'.format(stateVal1, stateVal2)
Chained callback
한 입력 컴포넌트의 변화가 다른 입력 컴포넌트의 변화를 이끌어내는 연쇄적인 콜백을 사용가능
#------------------------------------------------------------------------------
all_options = { 'America': ['New York', 'San Francisco', 'chicago'],
                'Korea': ['Seoul', 'Busan', 'Jeju'] }
#------------------------------------------------------------------------------
app.layout = html.Div([
    dcc.RadioItems(id='rdo_countries',
        options=[{'label':k, 'value':k} for k in all_options.keys()],
        value='Korea'), html.Hr(),
    dcc.RadioItems(id='rdo_cities'), html.Hr(),
    html.Div(id="my-output_selectedVal"),
])

@app.callback(
    Output('rdo_cities',    'options'),
    Input( 'rdo_countries', 'value')
)
def set_cities_options(selected_country):
    return [{'label': i, 'value': i} for i in all_options[selected_country]]

@app.callback(
    Output('rdo_cities', 'value'),
    Input('rdo_cities',  'options')
)
def set_cities_value(available_options):
     return available_options[0]['value']

@app.callback(
    Output('my-output_selectedVal', 'children'),
    Input('rdo_countries', 'value'),
    Input('rdo_cities',    'value')
)
def set_display_children(selected_country, selected_city):
    return '{} is a city in {}'.format( selected_city, selected_country)
Dash Plotly 콜백함수 간 데이터 공유
State를 sharing
여러 Callback이 큰 비용의 데이터 처리 작업(SQL 쿼리작성, 시뮬레이션실행 또는 데이터 다운로드…)에 의존할 때,
하나의 콜백이 해당 작업을 실행하도록 한 다음, 나머지 콜백과 결과만 공유 가능하다.
cf.> Callback함수 내에서 외부Scope에 선언되어 있는 변수의 값을 바꾸지 못한다
==> 아무 전역 변수의 값을 바꾸는 건 안전하지 않다.
.
콜백간에 데이터 공유
여러 파이썬 프로세스에서 데이터를 안전하게 공유하려면, 각 프로세스에서 액세스 할 수 있는 어딘가에 데이터를 저장해야한다. 이 데이터를 저장하는 세 가지 주요 위치는 다음과 같다.
- 사용자의 브라우저 세션
- 디스크 (예 : 파일 또는 새 데이터베이스)
- Redis와 같은 공유 메모리 공간
Dash Enterprise
최적의 User-Interaction과 차트 로딩 성능을 위해, dash 앱 Production버전은 아래 사항을 고려해야 한다.
| Job Queue | Queueing 은 ML/AI apps의 확장성의 가장 중요한 요소이다. Background jobs은 Dash app의 확장성를 크게 개선시킨다. callback loops에서 느리고, cpu를 많이사용하는 task의 부하를 줄임으로써, 이에 따라 Dash 프론트앤드는 request가 밀리게 되었을 때 발생할 수 있는 성능이슈를 줄여줌으로써, incoming web requests를 바로바로 처리가능하다. |
| HPC | HPC(High-Performance Computing, 고성능 컴퓨팅) – Hardware Acceleration puts Python’s most popular HPC stack in the hands of business users. Over the past 2 years, Dask and NVIDIA RAPIDS have changed the Python HPC landscape. Heavy, expensive Spark clusters are no longer necessary for terabyte-scale work in Python. Dash Enterprise ships with turnkey support for horizontally scalable Dask clusters and GPU computing. |
| Datashader | Big Data Pipelines Dash Enterprise is your front end for horizontally scalable, big data computation in Python. Python이 어떤 DB에 접속하면, 사용자는 DB에 연결된 dash app을 통해 쉽게 일처리할 수 있다. 모든 DB벤더가 python connector library (sqlalchemy, pymongo, pyscopg2… )제공하고 있기 때문에 예를 들어, 개발한 Dash App(Sentiment analysis app)은 python’s Snowflake connector를 통해 Snowflake DB에 접속해서, 고객데이터를 읽고, NLP sentiment analysis(자연어 처리를 통한 감정분석)을 수행하고, Snapshot Engine을 통해 pdf로만들어진 보고서를 email로 전송한다. |
| horizontal scaling | Kubernetes Scaling the only analytic app deployment platform that can scale to New York Times levels of traffic. Dash applications are stateless by design – no information about the state of the client is stored on the Dash server. Instead, the client state (which users are logged in or which radio button is selected, etc) is bundled into each request to the Dash server. Why is this important? With stateless design, Dash application servers can scale horizontally on modern infrastructure like Kubernetes. |
