Dash2. Layout -dbc (Bootstrap Components)
Dash App에 Bootstrap CSS 와 JS embeded시키기
Bootstrap is an open source toolkit for developing with HTML, CSS, and JS.
code
How to embed Bootstrap CSS & JS in your Python Dash app
COVID-19 infection forecaster app
Bootstrap과 Dash(Flask, Plotly.js and React js.)의 통합을 통한 web app 개발
dataset : CSSE COVID-19 dataset
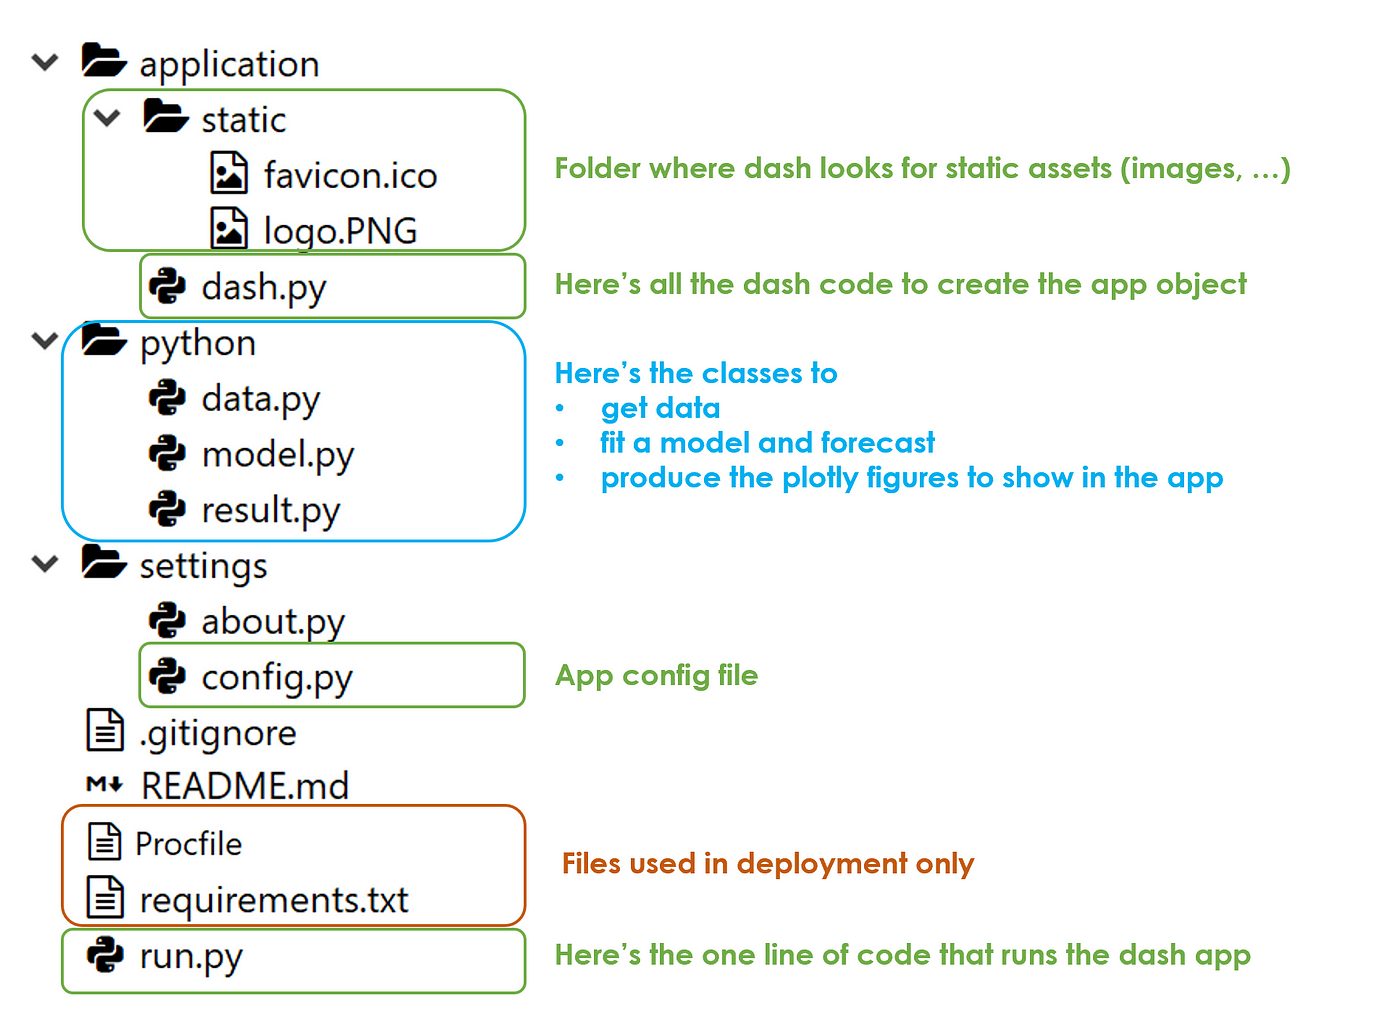
0. Setup 및 폴더 구조
- application 폴더: 모든 dash코드 (dash.py)
- python 폴더: 모델의 로직
- settings 폴더: 설정
- run.py :
python run.py
1. Back-end: get data, process, plot data
1. 데이터 수집 클래스
python/data.py : Data클래스
App시작시 실행되는 method (App이 동작하는페이지가 로드될때 마다)
– get_data
Back-end는 바로 소스로부터, 최신데이터를 받게 된다.
– group_by_country
선택할 country 목록에 대해는 저장되어 있어야함.
front-end로부터 input값(선택된 country) 을 받는 methods.
– process_data
data를 filter, process
2. 과거자료 학습하는 모델 과 예측
모델설명 here : model to fit data
a parametric curve fitting approach, optimizing the parameters of a logistic function for each country time series.
python/model.py “Model” class
– “forecast” function
App시작시에는 world에 대해 실행되고, 기본적으로 front-end에서 특정국가선택시 실행된다.
- the actual data and the fitted logistic model, which shall be used to plot the total cases
- the daily change of the actual data and the fitted logistic model (delta t = y t — y t-1), which shall be used to plot the active cases.
3. Plotting
Plotly as Dash
python/result.py : Data클래스
- “plot_total” : 시계열 전체와 예측값을 plotting
- “plot_active” : active cases의 시계열과 예측값을 plotting
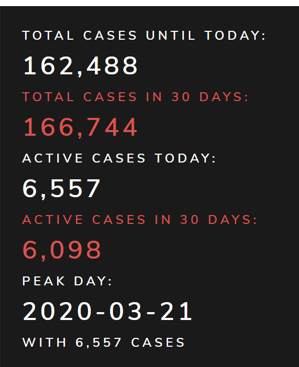
- “get_panel” : front-end 에 보여주기 위해 관련 통계량을 가져오는 함수
2. Front-end: Dash and DBC(Dash Bootstrap Components)
Build the app with Dash and Bootstrap
application/dash.py :
dbc는 Bootstrap CSS theme를 선택하는 기능을 제공하는데,
이를 app instance을 정의하는데 사용할 수 있다.
top navbar.
CSS 와 JS 코드 작성의 시간을 줄이기위해 Bootstrap을 이용해서, top navbar를 만든다.
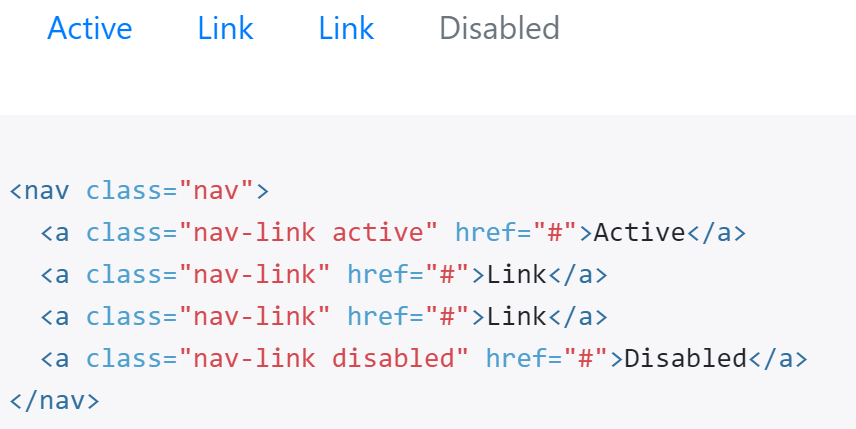
dbc를 사용해서 navbar와 그 items을 만들어냈다.
You got the gimmick, right?
Dash 와 Dbc는 html문법에 맞게 같은 구조와 로직을 복재한다.
각 item내부적으로는 우리가 무엇을 원하든지 추가할수 있다.

input form
기본값은 World를 포함해서 가능한 country들을 drop-down메뉴를 통해 선택할수 있도록 한다
# read data
이를 위해, drop-down의 item으로 사용될 country 데이터를 우선 읽어들여야한다. (python/data.py의 Data클래스)
Data obj.에 country 목록을 가지고 있기 때문에, for loop를 통해 option과 dropdown 메뉴를 만들수 있다.
# Read data
from python.data   import Data
data = Data()
data.get_data()# App Instance

dcc.Dropdown(id="country",
             options=[{"label":x,"value":x} for x in data.countrylist],
             value="World"
            )
사용자가 한눈에 스크롤 없이 데이터를 볼수 있도록 하기 위해, tabs을 활용해서,
python/result.py에서 코딩한 plot을 보여준다.
I bet you’re wondering “how does the app know that in the first tab it has to put the first plot and in the second the other?”.
Well, you’re not wrong, the app needs a link between the html and the Python code output.
In Dash this is done with callbacks.
A callback is nothing more than a decorator,
a function that takes another function and extends the behavior of the latter function without explicitly modifying it.
Let’s take the plot of total cases as an example:
I need a function that takes the country selected from the front-end as input and returns the plot as output using the Model and Result classes I coded before (in python folder). Something like this:
#  plot total cases
@app.callback(
def plot_total_cases(country): ...
As you surely noticed, in the previous code where I defined the tabs,
I put an id in the first one (id=”plot-total”).
So I need to add, on top of this function, a callback decorator to tell the app that the figure the back-end will plot refers to that id and that the input is the country value.
@app.callback(output=Output("plot-total","figure"),
              inputs=[Input("country","value")])
Ultimately, the panel on the right with some statistics is a little different because the python function doesn’t return a plot like before but an entire html div. In fact, the dash code this time is going to be inside the callback function that calculate those numbers. I’m talking about this:
This covers pretty much all the elements of the front-end layout,
it’s a very basic application with one single input and few outputs (plots and numbers).
run the App
/run.py
How do we find out if we made any errors in the code?
We run the application.
Only one line of code is necessary to run the whole thing and I shall put it in the run.py file (on root level)
Run the following command in the terminal:
$ python run.py
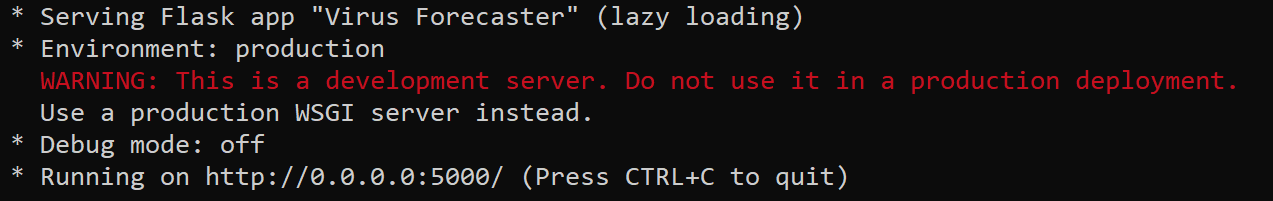
Great job, the application is up and running!
3. Deploy
Do you want to make your application available for anyone?
Then you have to deploy it somewhere. I usually use Heroku, a cloud platform as a service that allows deploying a PoC app with just a free account.
You can link a Github repo and deploy one of the branches.
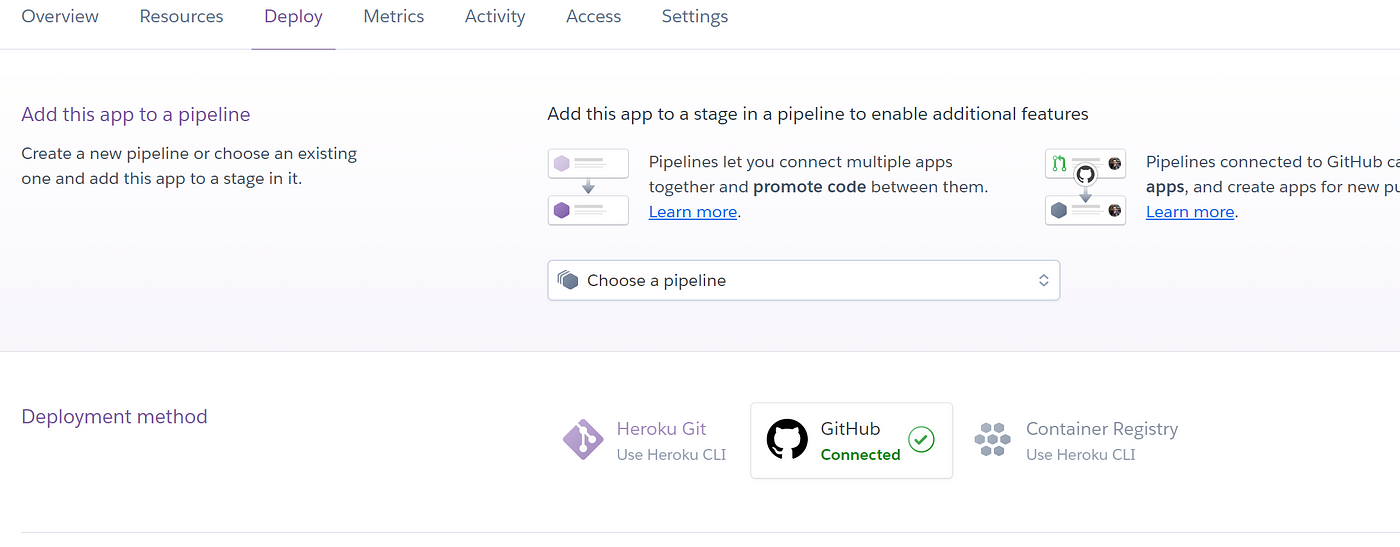
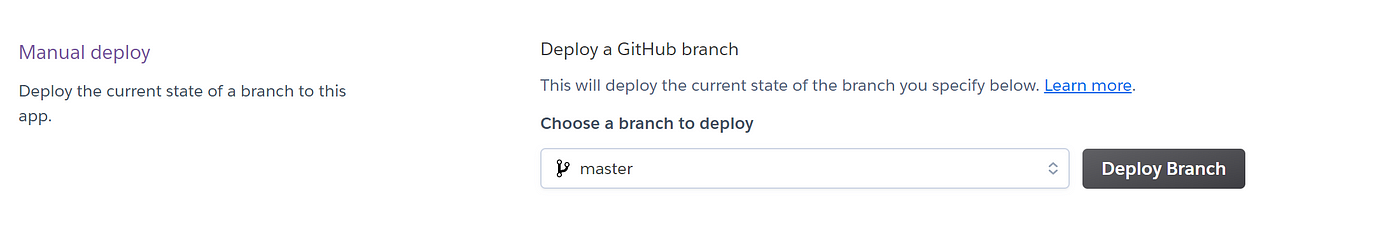
In order for this to work, the app needs a requirements.txt and a Procfile. In the Setup section, I already put the command to create the text file with the required packages. In regard to the Procfile, it’s just the command line to run the app that I put in the previous section. Heroku will run it and there you go:
Conclusion
This article has been a tutorial to show how easy is to build a nice looking web application with Dash and Dash Bootstrap Components that embeds all the CSS and JS of Bootstrap. I used my Covid-19 infection forecaster app as example, going through every step from back-end to front-end and even deployment. Now that you know how it works, you can develop your own forecaster, for example changing the data source (i.e. yahoo finance) and the machine learning model (i.e. lstm neural network) you can build a stock price forecaster.
