plotly.Graph_object
trace=[]
trace.append(
	go.Scatter(
		x= df['x'],
		y= df['y']
		mode='markers'
	)
)
layout = go.Layout()
fig = go.Figure(
	data=trace, layout=layout)
fig.show()
fig = go.Figure()
fig.add_trace(
go.Scatter(
x= df['x'],
y= df['y']
mode='markers'
)
)
fig.update_layout()
fig.show()https://plotly.com/python-api-reference/plotly.graph_objects.html
low-level interface to figures, traces and layout
import plotly.graph_objects as go

Figure(data=None, layout=None, frames=None, skip_invalid=False, **kwargs)
Bar Chart
https://plotly.com/python/bar-charts/
Layout : https://plotly.com/python/reference/layout/
go vs. px
plotly.graph_objects (as go) vs. plotly.express (as px)
#!/usr/bin/env python
# coding: utf-8
import plotly.express as px
iris = px.data.iris()
df = iris.copy()

# plotly.express
fig = px.scatter(df,
    x="sepal_width", y="sepal_length",
    color="species", size='petal_length',
    hover_data=['petal_width']
)
fig.show()

# plotly.graph_objects
import plotly.graph_objects as go
fig = go.Figure()
fig.add_trace(
    go.Scatter(
        x=df[df.species=='setosa']['sepal_width'],
        y=df[df.species=='setosa']['sepal_length'],
        mode='markers', #name='setosa',
        marker=dict(
            color='#6973FB',
            size=df[df.species=='setosa']['petal_length']*10
        )
    )
)
fig.add_trace(
    go.Scatter(
        x=df[df.species=='versicolor']['sepal_width'],
        y=df[df.species=='versicolor']['sepal_length'],
        mode='markers', #name='versicolor',
        marker=dict(
            color='#F1644D',
            size=df[df.species=='versicolor']['petal_length']*5
        )
    )
)
fig.add_trace(
    go.Scatter(
        x=df[df['species']=='virginica']['sepal_width'],
        y=df[df['species']=='virginica']['sepal_length'],
        mode='markers', #name='virginica',
        marker=dict(
            color='#29C99F',
            size=df[df['species']=='virginica']['petal_length']*4.6
        )
    )
)
fig.update_layout(
    xaxis = dict(title='sepal_width'),
    yaxis = dict(title='sepal_length'),
    legend_title_text='species',
    title = 'plotly.graph_objects'
)
fig.show()
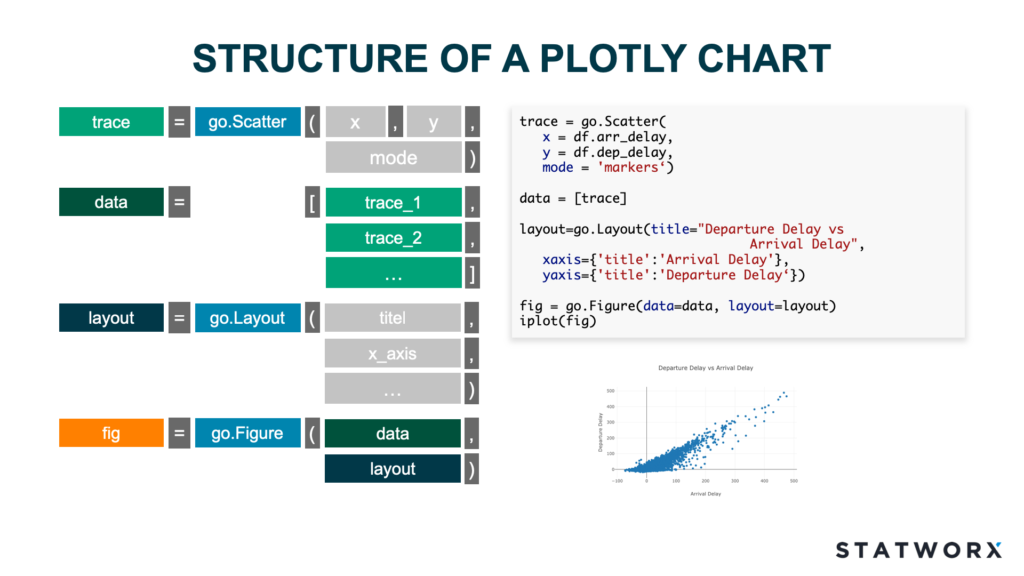
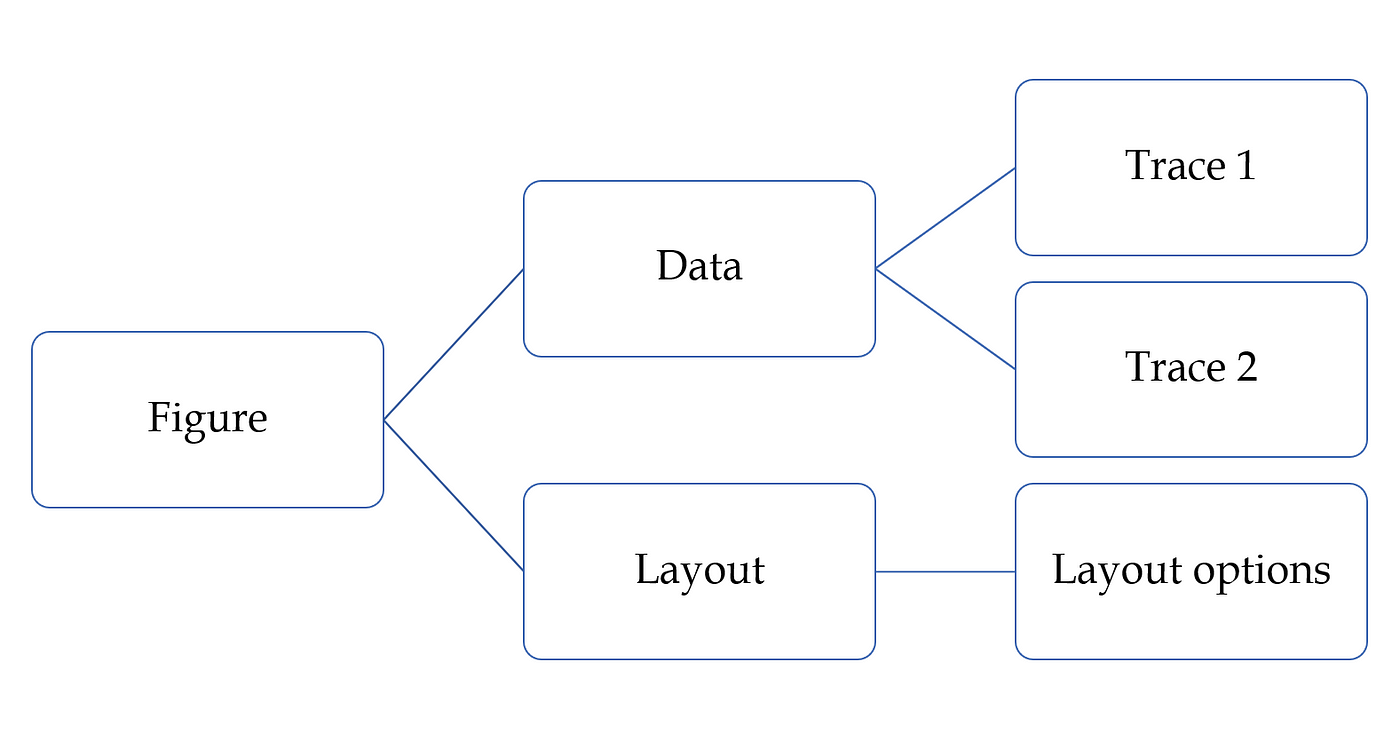
Figure 의 구조
import plotly.graph_objects as go
fig = go.Figure()
plotly의 graph_object인 go의 Figure에는 2가지 속성 즉, Data와 Layout 이 있다.
https://github.com/santosjorge/cufflinks
Data 객체 입력방식
import pandas as pd
import numpy as np
import plotly.graph_objects as go
import plotly.express as px
# pd.set_option('display.max_row', 500)
# pd.set_option('display.max_columns', 100)
# pd.options.plotting.backend = "plotly"

import chart_studio.plotly as py
import cufflinks as cf

df = pd.read_csv('../data/kc_house_data.csv')

px.scatter(df,
    x="date", y="price",
    hover_data=['id']
).show()

#-------------------------

trace1 = go.Scattergl(
    x= df.sqft_living15,
    y= df.price,
    mode='markers',
    marker = dict(
        opacity=0.5
    )
)
layout = go.Layout(
    title = 'Price vs. Living Room Area',
    xaxis = dict(title='Living room area (sq. ft.)'),
    yaxis = dict(title='Price ($)'),
    hovermode = 'closest'
)
fig = go.Figure(data=[trace1], layout=layout)
fig.show()
