titanic
https://www.kaggle.com/c/titanic
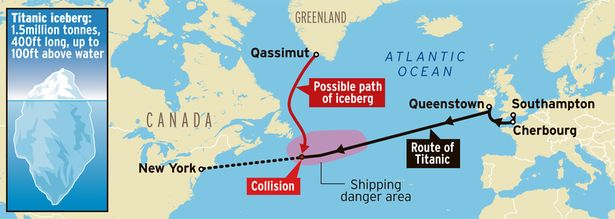
https://www.mirror.co.uk/news/uk-news/iceberg-sunk-titanic-100000-years-7506651
https://www.kaggle.com/erikbruin/titanic-2nd-degree-families-and-majority-voting
‘PassengerId’, ‘Survived’, ‘Pclass’, ‘Name’, ‘Sex’, ‘Age’, ‘Fare’, ‘Embarked’
library(Hmisc)
library(knitr)
library(ggplot2)
library(dplyr)
library(caret)
library(randomForest)
library(ROCR)
library(cowplot)

train <- read.csv("./input/train.csv", stringsAsFactors=F, na.strings = c("NA", ""))
test  <- read.csv("./input/test.csv",  stringsAsFactors=F, na.strings = c("NA", ""))

train %>% str
test %>% str

test$Survived <- NA
all <- rbind(train, test)

# Check Missing Data
sapply(all, function(x) {sum(is.na(x))}) [sapply(all, function(x) {sum(is.na(x))}) >0]

all$Survived <- as.factor(all$Survived)
all$Sex      <- as.factor(all$Sex)
all$Pclass   <- as.ordered(all$Pclass)

all[!is.na(all$Survived),] %>%
    ggplot(aes(x=Survived, fill=Survived)) +
        geom_bar(stat='count') +
        geom_label(stat='count', aes(label=..count..)) +
        labs(x='How many people died and survived on the Titanic?')

p1 <- all %>%
        ggplot(aes(x=Sex, fill=Sex)) +
        geom_bar(stat='count', position='dodge') +
        geom_label(stat='count', aes(label=..count..)) +
        labs(x='All data')

p2 <- all[!is.na(all$Survived),] %>%
        ggplot(aes(x=Sex, fill=Survived)) +
        geom_bar(stat='count', position='dodge') +
        geom_label(stat='count', aes(label=..count..)) +
        labs(x='Training data only')

plot_grid(p1, p2)


ggplot(diamonds, aes(clarity, fill = cut)) + geom_bar() +
    theme(axis.text.x = element_text(angle=70, vjust=0.5)) +
draw_label("DRAFT!", angle = 45, size = 80, alpha = .2) 